Aggregate CCE Logs with Promtail & Grafana Loki
This blueprint explains how to collect and centralize logs from Cloud Container Engine (CCE) using Promtail and Grafana Loki. It outlines the process of configuring Promtail as a log forwarder within Kubernetes and integrating it with Grafana Loki for efficient storage and visualization. By the end, you will have a unified and scalable logging setup that simplifies monitoring, troubleshooting, and operational insights across your CCE workloads.
Promtail has been officially deprecated and was transitioned into Long-Term Support (LTS) on February 13, 2025. The project continues to receive only essential security and critical bug fixes, with no new feature development. The LTS phase is planned to last approximately one year, ending on February 28, 2026, after which Promtail will enter its End-of-Life (EOL) phase on March 2, 2026. Once EOL is reached, maintenance, updates, and official support will cease entirely.
All new feature development and enhancements have moved to Grafana Alloy, which replaces Promtail as the actively maintained log collection agent.
If you are using Promtail, we are strongly recommending you migrate to Alloy or choose another forwarding solution, as Fluent-Bit that we already describe in another blueprint, Aggregate CCE Logs with Fluent Bit & Grafana Loki, how to integrate with Loki.
If you are currently using Promtail, it is strongly recommended to migrate to Grafana Alloy or adopt an alternative log forwarding solution such as Fluent Bit. The blueprint Aggregate CCE Logs with Fluent Bit & Grafana Loki provides detailed guidance on integrating Fluent Bit with Loki for a reliable and future-proof logging setup.
Grafana Loki serves as a log aggregation system optimized for scalability, availability, and cost efficiency. Drawing inspiration from Prometheus, Loki indexes only metadata through labels rather than the log content itself. It was introduced by Grafana Labs in 2018.
Loki uses Promtail to aggregate logs. Promtail is a logs collector agent that collects, labels, and ships logs to Loki. It runs on each Kubernetes node, using the same service discovery as Prometheus and supporting similar methods for labeling, transforming, and filtering logs before their ingestion to Loki.
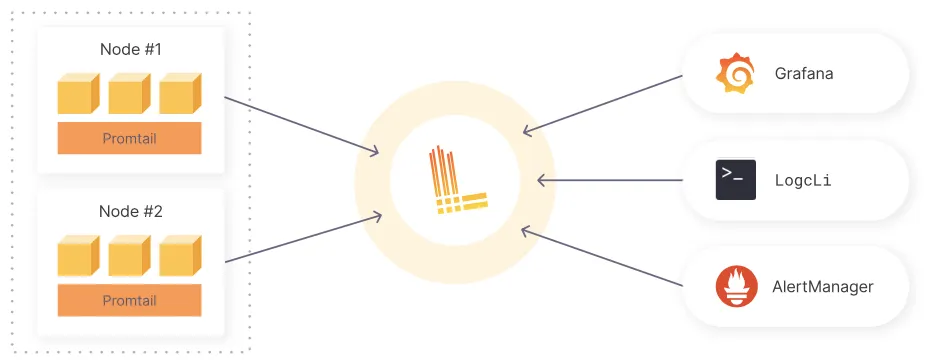
Loki groups log entries into streams and indexes them with labels, which reduces overall costs and the time between log entry ingestion and query availability.
Installing Grafana Loki
If you don’t already have a Grafana Loki instance running, you can set it up first before proceeding with log aggregation. The installation process is covered in detail in the companion blueprint Deploy Grafana Loki on CCE, which explains how to deploy Loki in microservices mode on Cloud Container Engine (CCE) with T Cloud Public Object Storage (OBS) as the backend. Once Loki is up and running, you can continue here to install and configure Promtail and start collecting and centralizing logs from your CCE workloads.
Installing Promtail
Create a values file called values-promtail.yaml:
daemonset:
  enabled: true

resources:
  requests:
    cpu: 100m
    memory: 128Mi
  limits:
    cpu: 500m
    memory: 256Mi

tolerations:
  - key: "node-role.kubernetes.io/control-plane"
    operator: "Exists"
    effect: "NoSchedule"
  - key: "node-role.kubernetes.io/master"
    operator: "Exists"
    effect: "NoSchedule"

config:
  server:
    http_listen_port: 3101
    grpc_listen_port: 0

  positions:
    filename: /run/promtail/positions.yaml

  clients:
    - url: http://loki-gateway.monitoring.svc.cluster.local/loki/api/v1/push
      batchwait: 1s
      batchsize: 1048576
      backoff_config:
        min_period: 500ms
        max_period: 5s
        max_retries: 10
      timeout: 10s

  scrape_configs:
    - job_name: kubernetes-pods
      pipeline_stages:
        - cri: {}
        - json:
            expressions:
              msg: message | msg | log
              level: level | severity
              ts: ts | time | timestamp
        - timestamp:
            source: ts
            format: RFC3339
            action_on_failure: skip
        - output:
            source: msg
        - labels:
            level:
      kubernetes_sd_configs:
        - role: pod
      relabel_configs:
        - action: drop
          source_labels: [__meta_kubernetes_pod_phase]
          regex: (Succeeded|Failed)
        - action: replace
          source_labels: [__meta_kubernetes_namespace]
          target_label: namespace
        - action: replace
          source_labels: [__meta_kubernetes_pod_name]
          target_label: pod
        - action: replace
          source_labels: [__meta_kubernetes_pod_container_name]
          target_label: container
        - action: replace
          source_labels: [__meta_kubernetes_pod_label_app_kubernetes_io_name]
          target_label: app
          regex: (.+)
        - action: replace
          source_labels: [__meta_kubernetes_pod_label_app]
          target_label: app
          regex: (.+)
        - action: replace
          target_label: node
          replacement: ${HOSTNAME}
        # containerd/docker symlinked pod log path
        - action: replace
          source_labels: [__meta_kubernetes_pod_uid]
          target_label: __path__
          replacement: /var/log/pods/*$1/*.log
        - action: labeldrop
          regex: (pod_template_hash|controller_revision_hash)

rbac:
  pspEnabled: false

serviceMonitor:
  enabled: false
and deploy via Helm:
helm repo add grafana https://grafana.github.io/helm-charts
helm repo update

helm upgrade --install promtail grafana/promtail \
-f values-promtail.yaml \
-n monitoring --create-namespace \
--reset-values
Installing Grafana (Optional)
For verification, we’ll install Grafana with Helm and include a simple demo dashboard to confirm that logs are reaching Loki. This lightweight setup is only for validation and smoke testing. For most production clusters, the recommended approach is to deploy the kube-prometheus-stack bundle, which provides Grafana together with Prometheus, Alertmanager, and curated dashboards, offering tighter integration and easier ongoing operations.
Create a values file called values-grafana.yaml:
adminUser: admin

persistence:
  enabled: true
  size: 5Gi
  accessModes:
    - ReadWriteOnce
  storageClassName: "csi-disk"

service:
  enabled: true
  type: ClusterIP
  port: 80

resources:
  requests:
    cpu: 100m
    memory: 256Mi
  limits:
    cpu: 500m
    memory: 512Mi

datasources:
  datasources.yaml:
    apiVersion: 1
    datasources:
      - name: Loki
        type: loki
        access: proxy
        url: http://loki-gateway.monitoring.svc.cluster.local
        jsonData:
          maxLines: 1000
          derivedFields:
            - datasourceUid: Loki
              matcherRegex: "traceID=(\\w+)"
              name: TraceID
              url: "$${__value.raw}"
        isDefault: true
        editable: true

dashboardProviders:
  dashboardproviders.yaml:
    apiVersion: 1
    providers:
      - name: 'default'
        orgId: 1
        folder: ''
        type: file
        disableDeletion: false
        editable: true
        options:
          path: /var/lib/grafana/dashboards/default

dashboards:
  default:
    loki-logs:
      gnetId: 15141
      revision: 1
      datasource: Loki

grafana.ini:
  server:
    root_url: "%(protocol)s://%(domain)s:%(http_port)s/"
  analytics:
    check_for_updates: true
    check_for_plugin_updates: true
  log:
    mode: console
  paths:
    data: /var/lib/grafana/
    logs: /var/log/grafana
    plugins: /var/lib/grafana/plugins
    provisioning: /etc/grafana/provisioning

securityContext:
  runAsNonRoot: true
  runAsUser: 472
  runAsGroup: 472
  fsGroup: 472
  allowPrivilegeEscalation: false
  capabilities:
    drop:
      - ALL

serviceMonitor:
  enabled: false

rbac:
  create: true
  pspEnabled: false

serviceAccount:
  create: true
  autoMount: true
and deploy via Helm:
helm repo add grafana https://grafana.github.io/helm-charts
helm repo update

helm upgrade --install grafana grafana/grafana \
-f values-grafana.yaml \
-n monitoring --create-namespace \
--set "adminPassword=$(openssl rand -base64 24)" \
--reset values
Go to Grafana -> Dashboards and click the dashboard we provisioned as bundle with the Helm Chart Loki Kubernetes Logs:

💡 The Grafana admin password can be found in grafana secret in monitoring namespace.
⚠️ This Grafana installation and the provided dashboard are intended for demonstration purposes only.