CCE Logging with Grafana Loki & Promtail
In this blueprint, we'll consolidate all the logs generated in our Kubernetes cluster into a neat, real-time dashboard in Grafana.
Grafana is an analytics and interactive visualization platform. It offers a rich variety of charts, graphs, and alerts and connects to a plethora of supported data sources such as Prometheus, time-series databases, or well-known RDBMS. Grafana allows you to query, visualize, and create alerts on your metrics regardless of where they are stored.
Think of it as the equivalent of Kibana in the ELK stack.
Grafana Loki is a logs aggregation system designed to be horizontally scalable, highly available, and cost-effective. Inspired by Prometheus, Loki does not index the contents of the logs but rather a set of labels for each log stream. It was launched in 2018 by Grafana Labs.
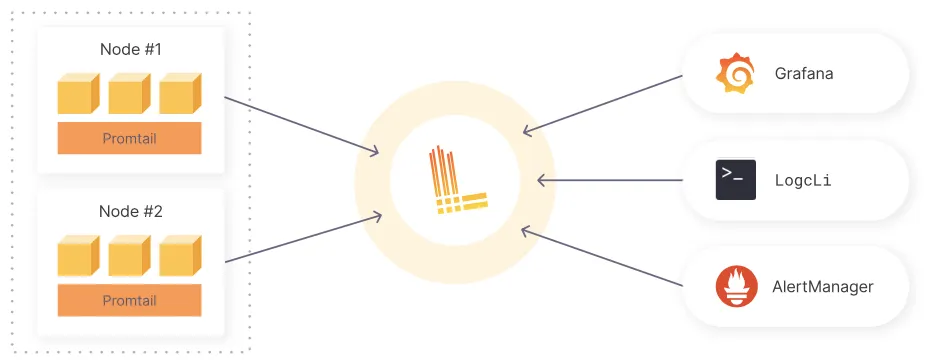
Loki uses Promtail to aggregate logs. Promtail is a logs collector agent that collects, labels, and ships logs to Loki. It runs on each Kubernetes node, using the same service discovery as Prometheus and supporting similar methods for labeling, transforming, and filtering logs before their ingestion to Loki.
Loki groups log entries into streams and indexes them with labels, which reduces overall costs and the time between log entry ingestion and query availability.
Think of Loki as the equivalent (not 1-to-1 but in a broader context) of Elasticsearch in the ELK stack.
Prerequisites
- CCE cluster.
- Grafana installation.
- Grafana Loki installation.
- Promtail agent on every node of the CCE cluster.
Installing Grafana
The installation is straightforward using Helm. If you haven’t installed Helm on your workstation, you can do it either with brew on macOS:
brew install helm
or with the following bash commands on Debian/Ubuntu Linux:
curl https://baltocdn.com/helm/signing.asc | gpg --dearmor | sudo tee /usr/share/keyrings/helm.gpg > /dev/null
sudo apt-get install apt-transport-https --yes
echo "deb [arch=$(dpkg --print-architecture) signed-by=/usr/share/keyrings/helm.gpg] https://baltocdn.com/helm/stable/debian/ all main" | sudo tee /etc/apt/sources.list.d/helm-stable-debian.list
sudo apt-get update
sudo apt-get install helm --yes
Now, we can install the Helm chart for Grafana:
helm repo add grafana https://grafana.github.io/helm-charts
helm repo update
helm install grafana grafana/grafana --namespace grafana --create-namespace
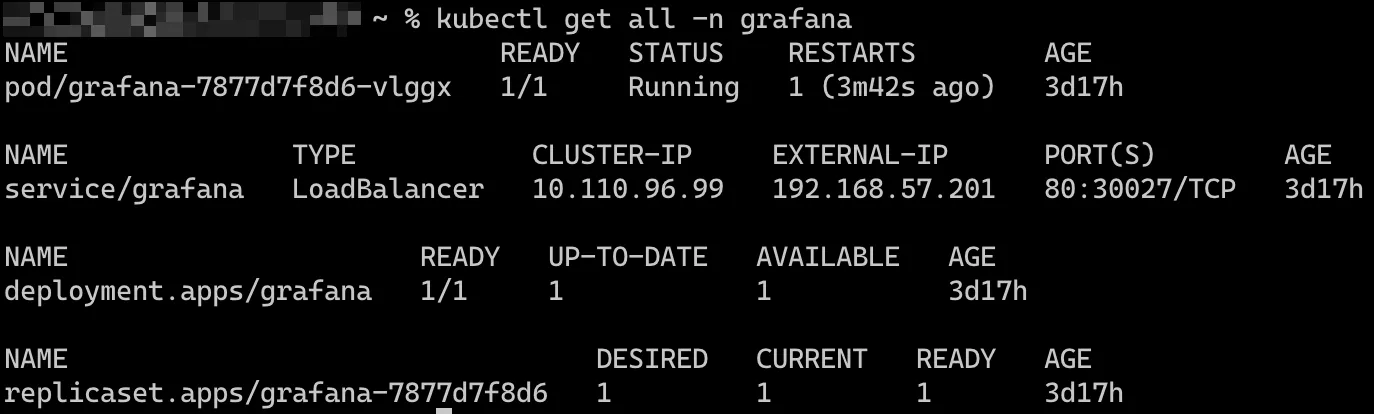
By default, the service/grafana will be of type ClusterIP. If you are not working on CCE, you can use MetalLB as a network load balancer and patch the service to be of type LoadBalancer. Alternatively, port-forwarding this service will suffice for now.
Installing Loki
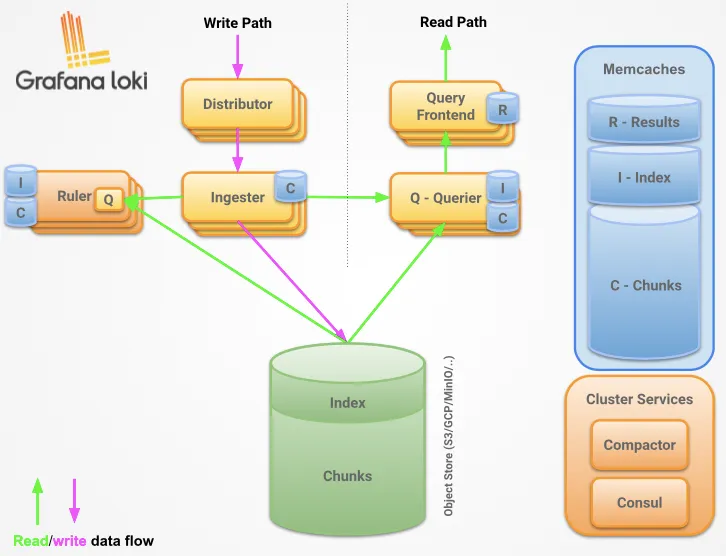
Loki consists of multiple components/microservices that can be deployed in three different modes:
that can be deployed in 3 different modes:
- Monolithic mode: All of Loki’s microservice components run inside a single process as a single binary.
- Simple Scalable mode: Separate read and write paths.
- Microservices mode: Every Loki component runs as a distinct process.
The scalable installation requires an S3 compatible object store such as AWS S3, Google Cloud Storage, Open Telekom Cloud OBS, or a self-hosted store like MinIO. In monolithic deployment mode, only the filesystem can be used for storage.
In this lab, we will use the microservices deployment mode with Open Telekom Cloud OBS as Loki’s storage. We will configure and install Loki and Promtail using Helm charts.
First, let's download the default chart values for each chart and make the necessary changes. For Loki, assuming you chose the loki-distributed chart:
helm show values grafana/loki-distributed > loki-distributed-overrides.yaml
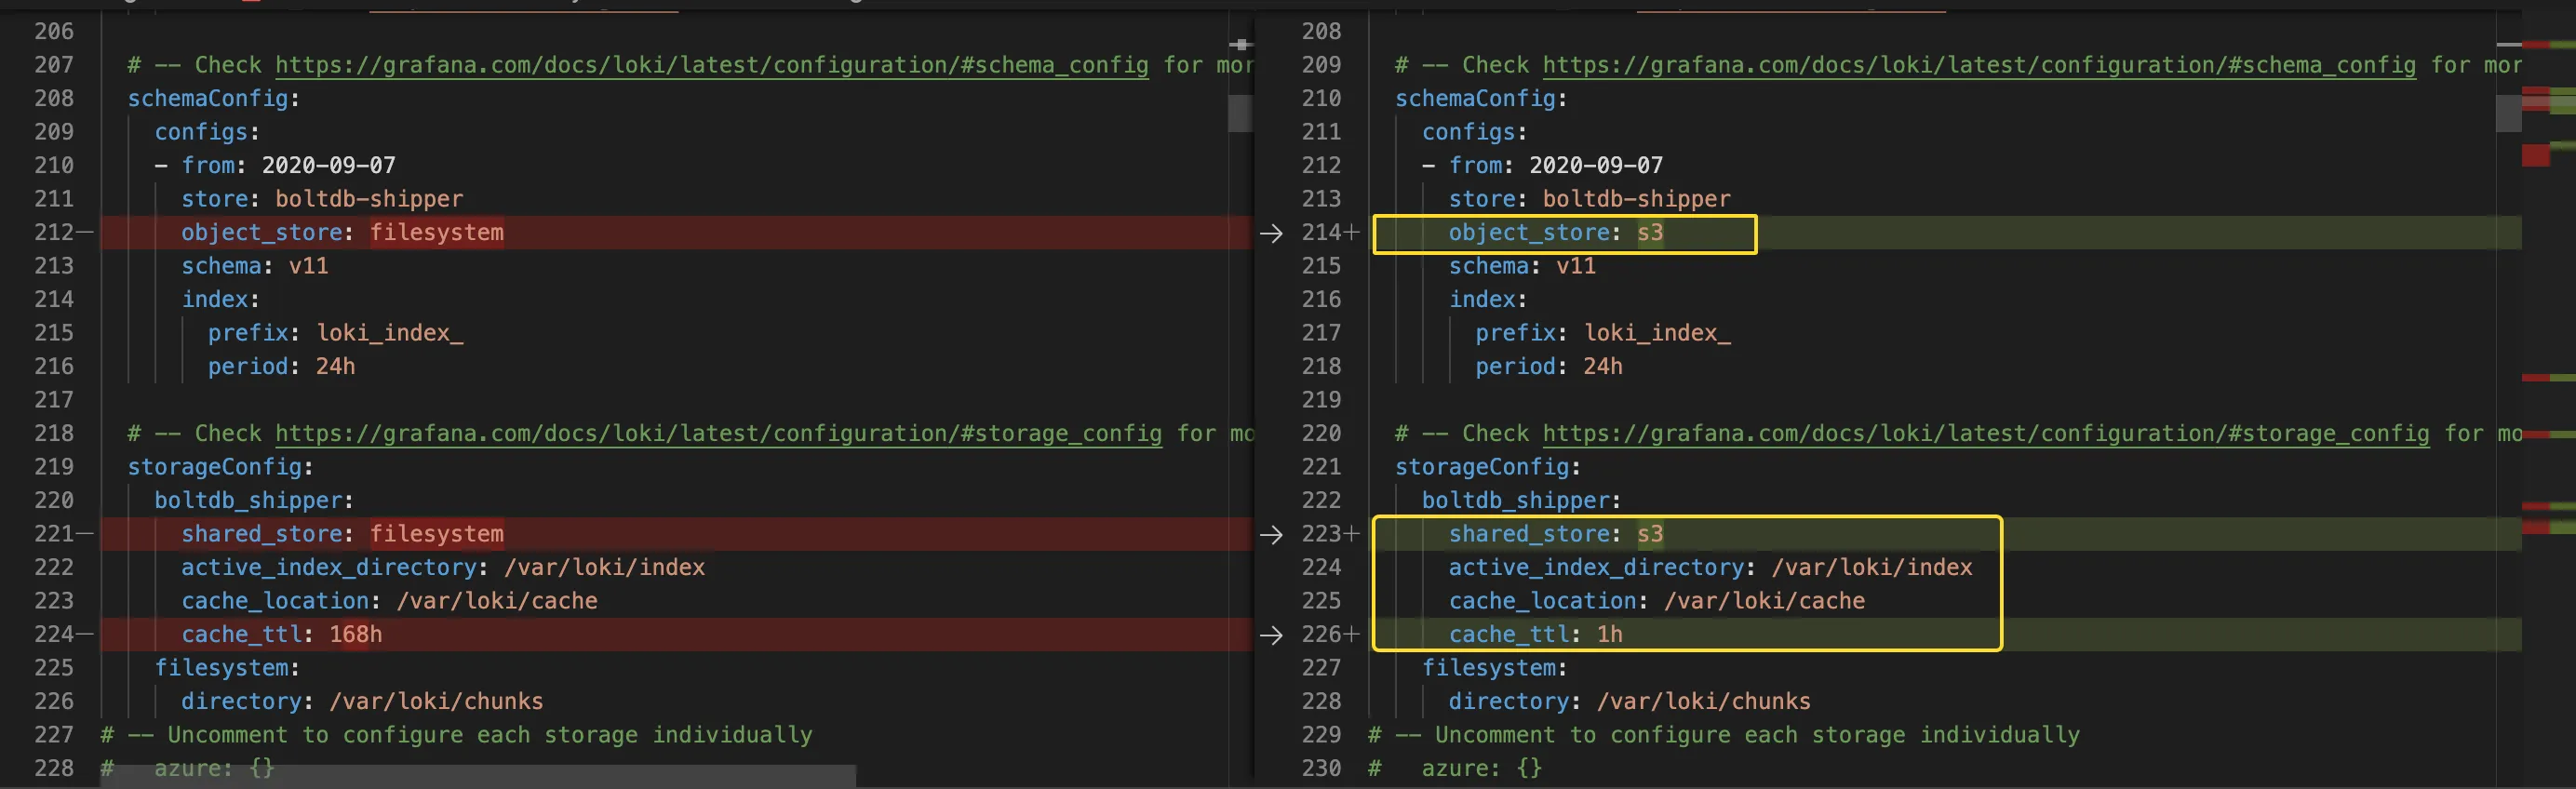
- If you are using S3 compatible storage, update the object and shared store target to S3 in your Helm chart values:
- Configure your storage to point to the designated S3 bucket:
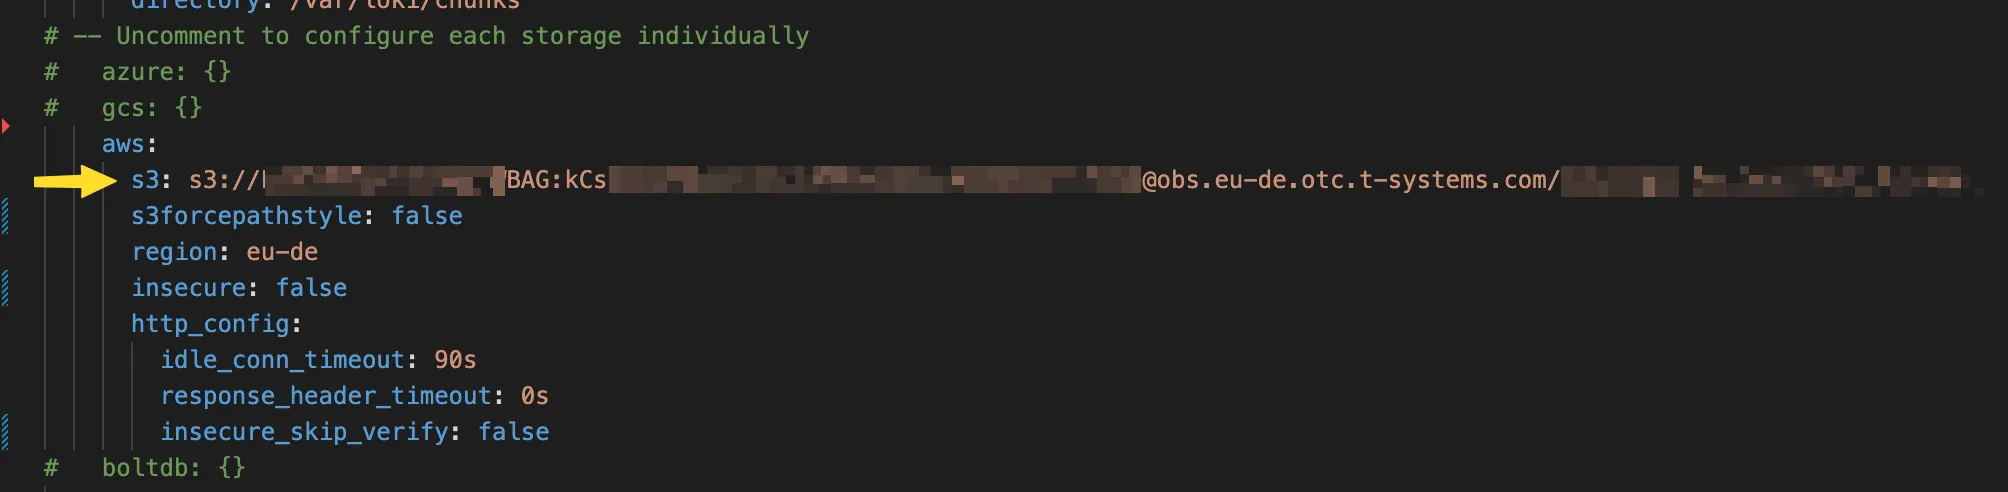
The format of S3 endpoint is s3://{AK}:{SK}@{endpoint}/{region}/{bucket}
- Next you have to enable the compactor:
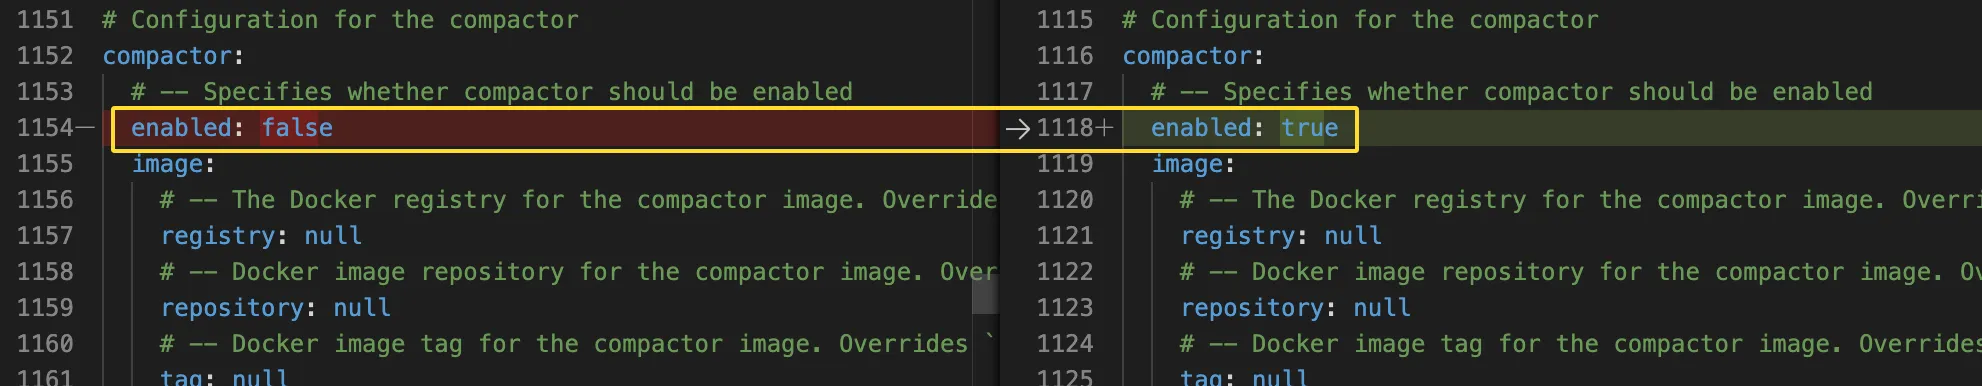
- Then configure the compactor:

- Now that the Loki values are set, install Loki and then move on to Promtail:
helm upgrade --install --values loki-distributed-overrides.yaml loki grafana/loki-distributed -n grafana-loki --create-namespace
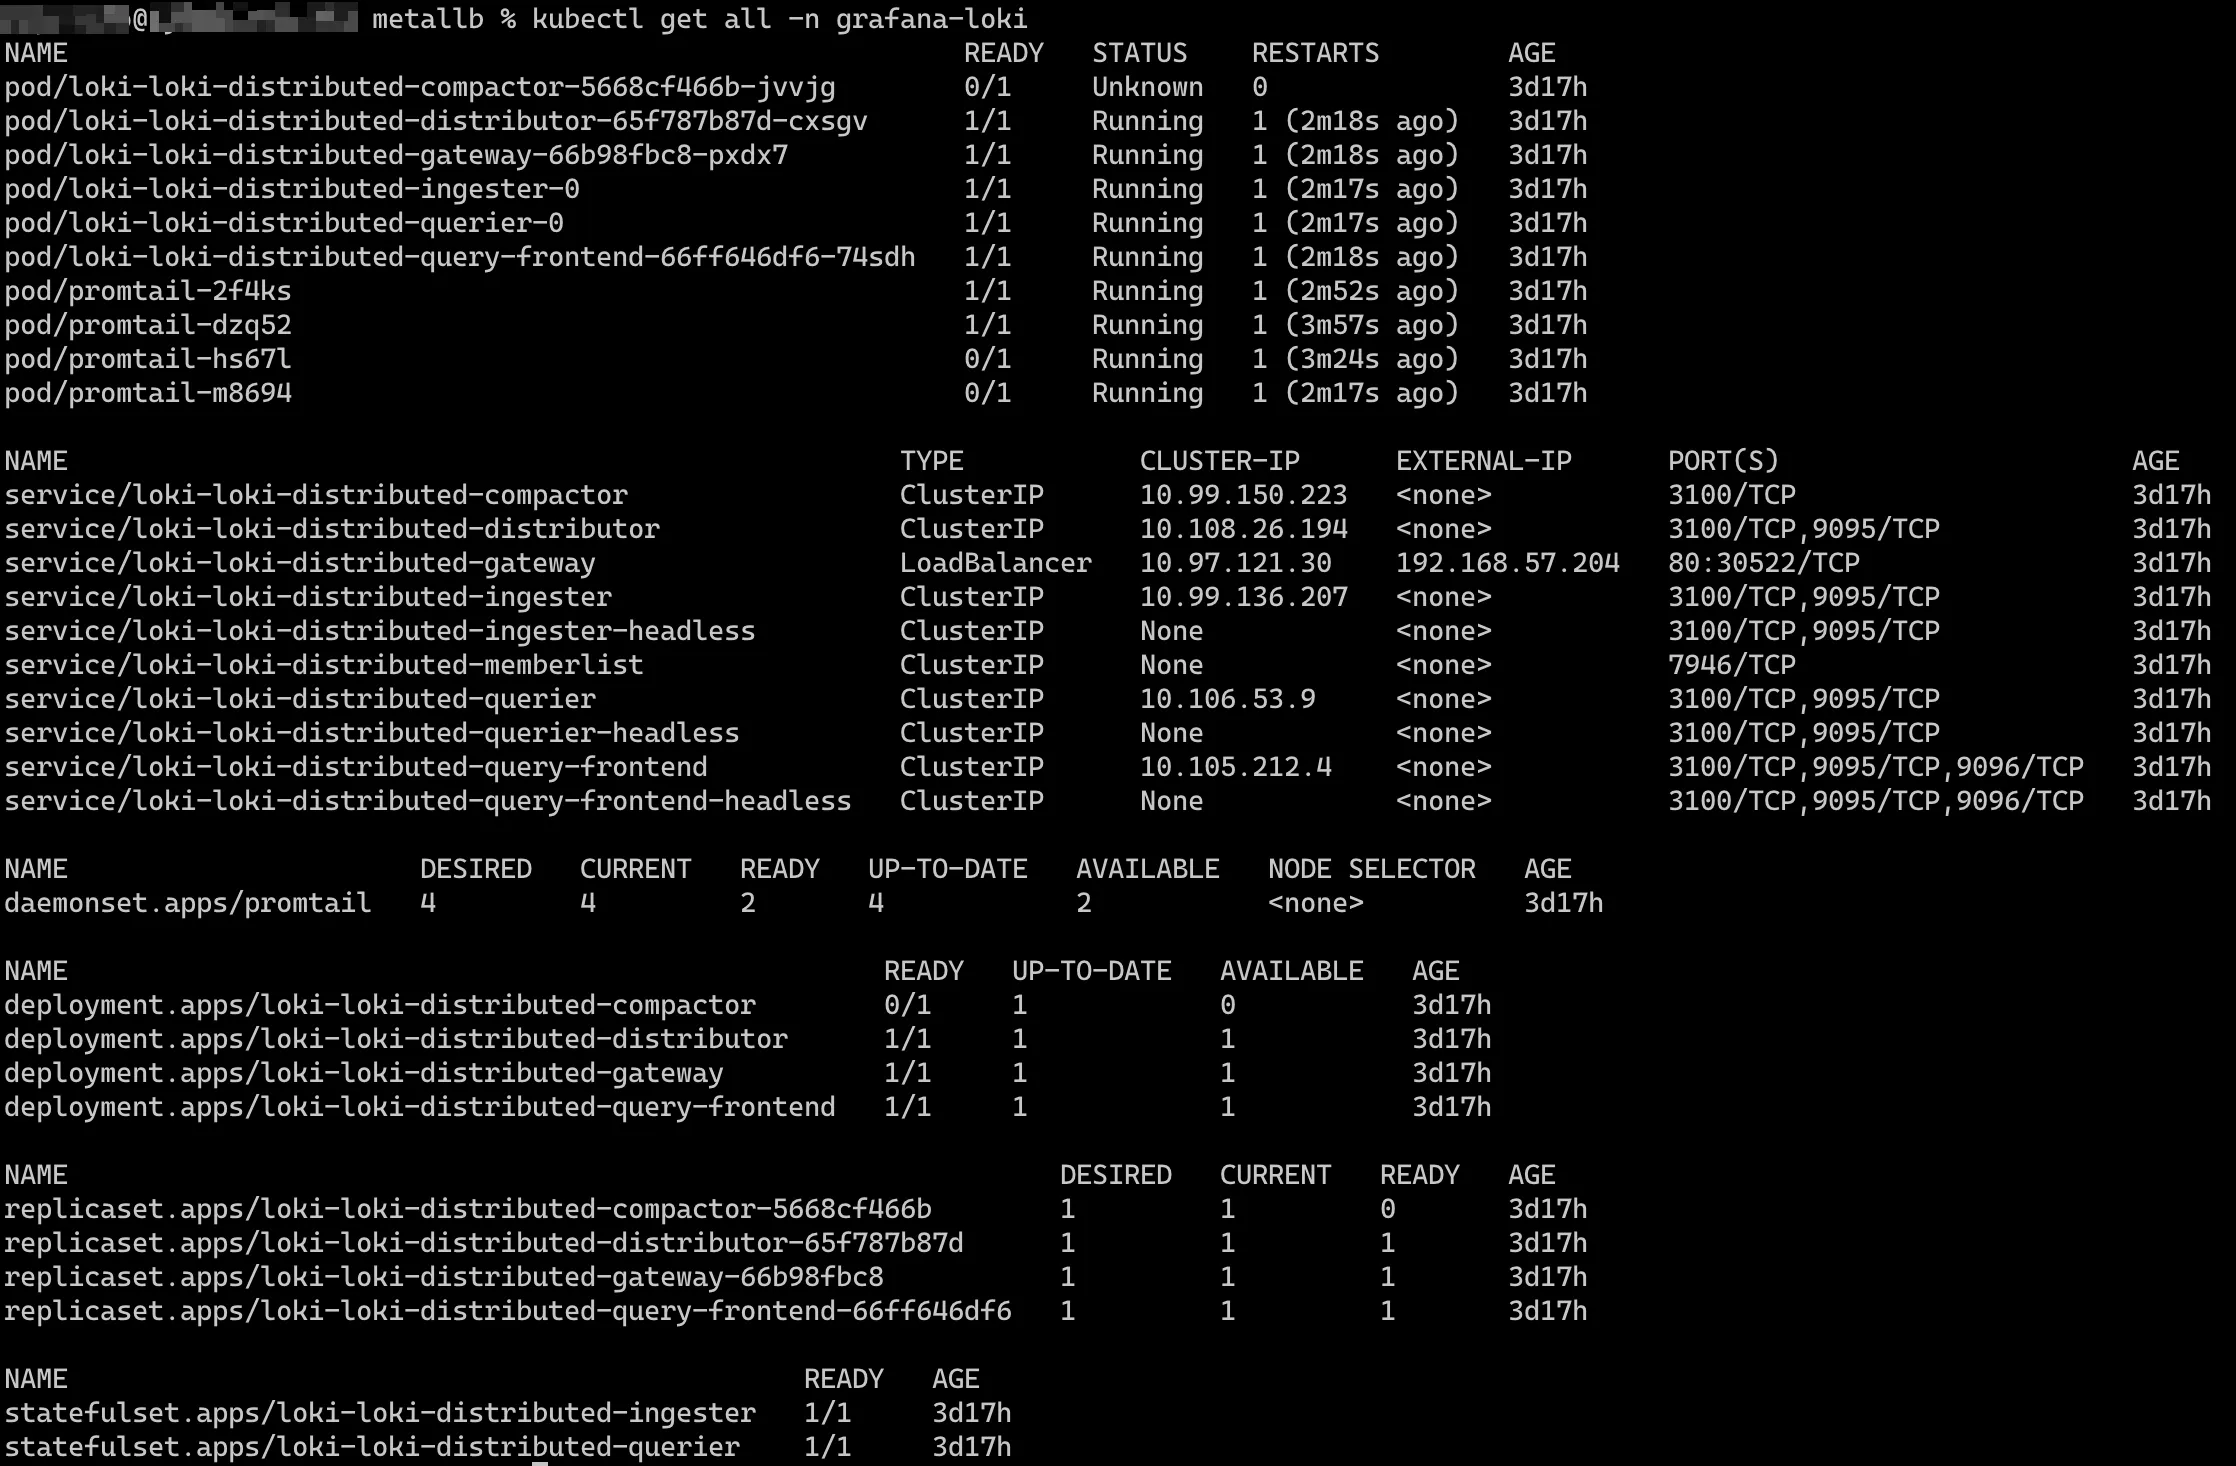
Get all the components that we installed from the Loki chart:
kubectl get all -n grafana-loki
Installing Promtail
We need the endpoint of Loki’s gateway as the designated endpoint that Promtail will use to push logs to Loki. In our case, that would be loki-loki-distributed-gateway.grafana-loki.svc.cluster.local. Add this endpoint to the Promtail chart values:
helm show values grafana/promtail > promtail-overrides.yaml

We are now ready to deploy Promtail. Run the command and wait for all pods to reach a Ready state:
helm upgrade --install --values promtail-overrides.yaml promtail grafana/promtail -n grafana-loki
Configuring Grafana Data Sources & Dashboard
- With all deployments completed, set up Grafana. As mentioned, Grafana has a simple service. Port-forward it and access Grafana directly from
[http://localhost:8080/](http://localhost:8080/):
kubectl port-forward service/grafana 8080:80 -n grafana
You can also expose this service in other ways, either by assigning an external IP via a Load Balancer or as an ingress route through your chosen Ingress solution.
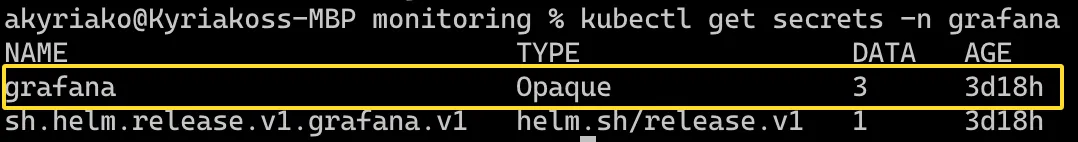
- You will need these credentials to log in. The default user is admin, but you will need to retrieve the password. Get all the
Secretsin the grafana namespace:
kubectl get secrets -n grafana
Extract and decode the password:
kubectl get secret grafana -n grafana -o jsonpath="{.data.admin-password}" | base64 --decode ; echo
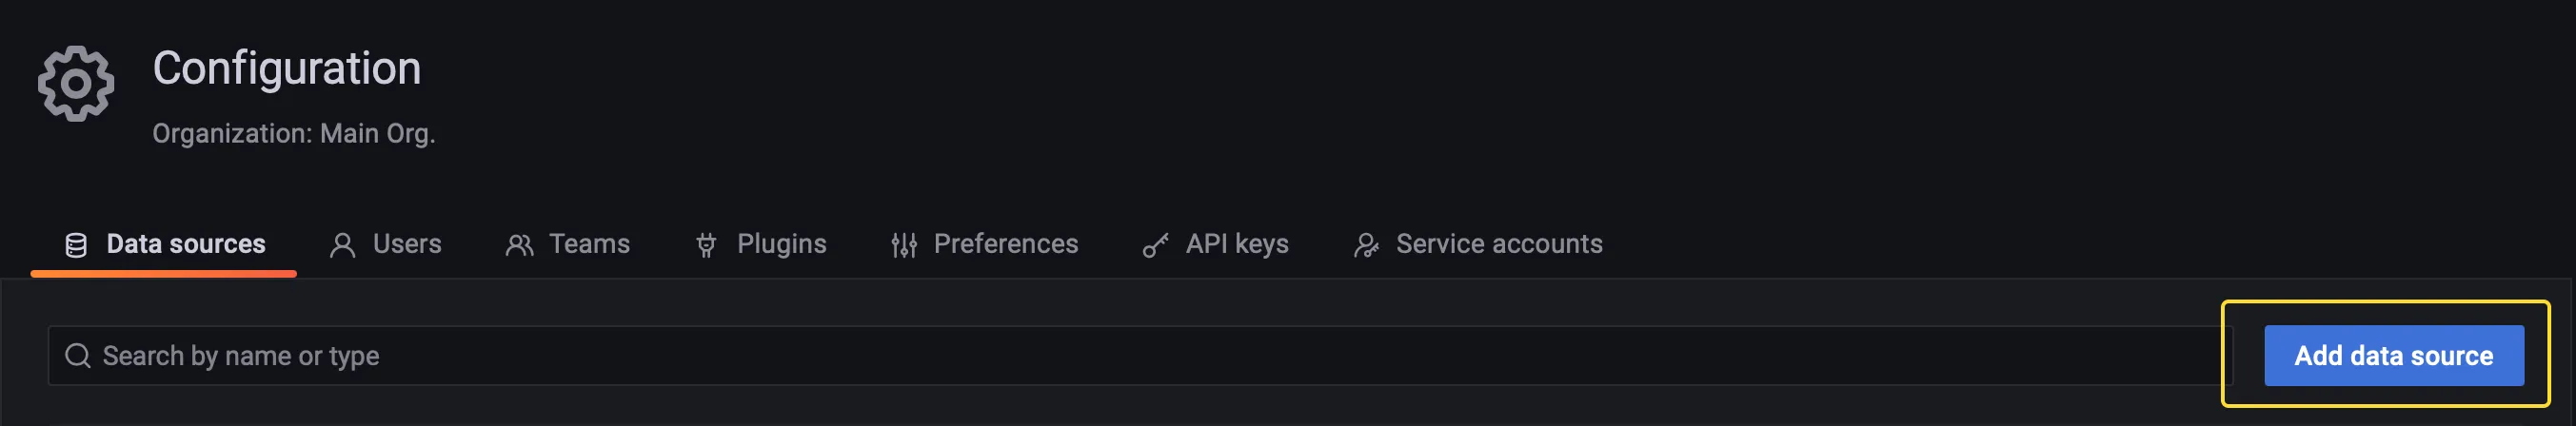
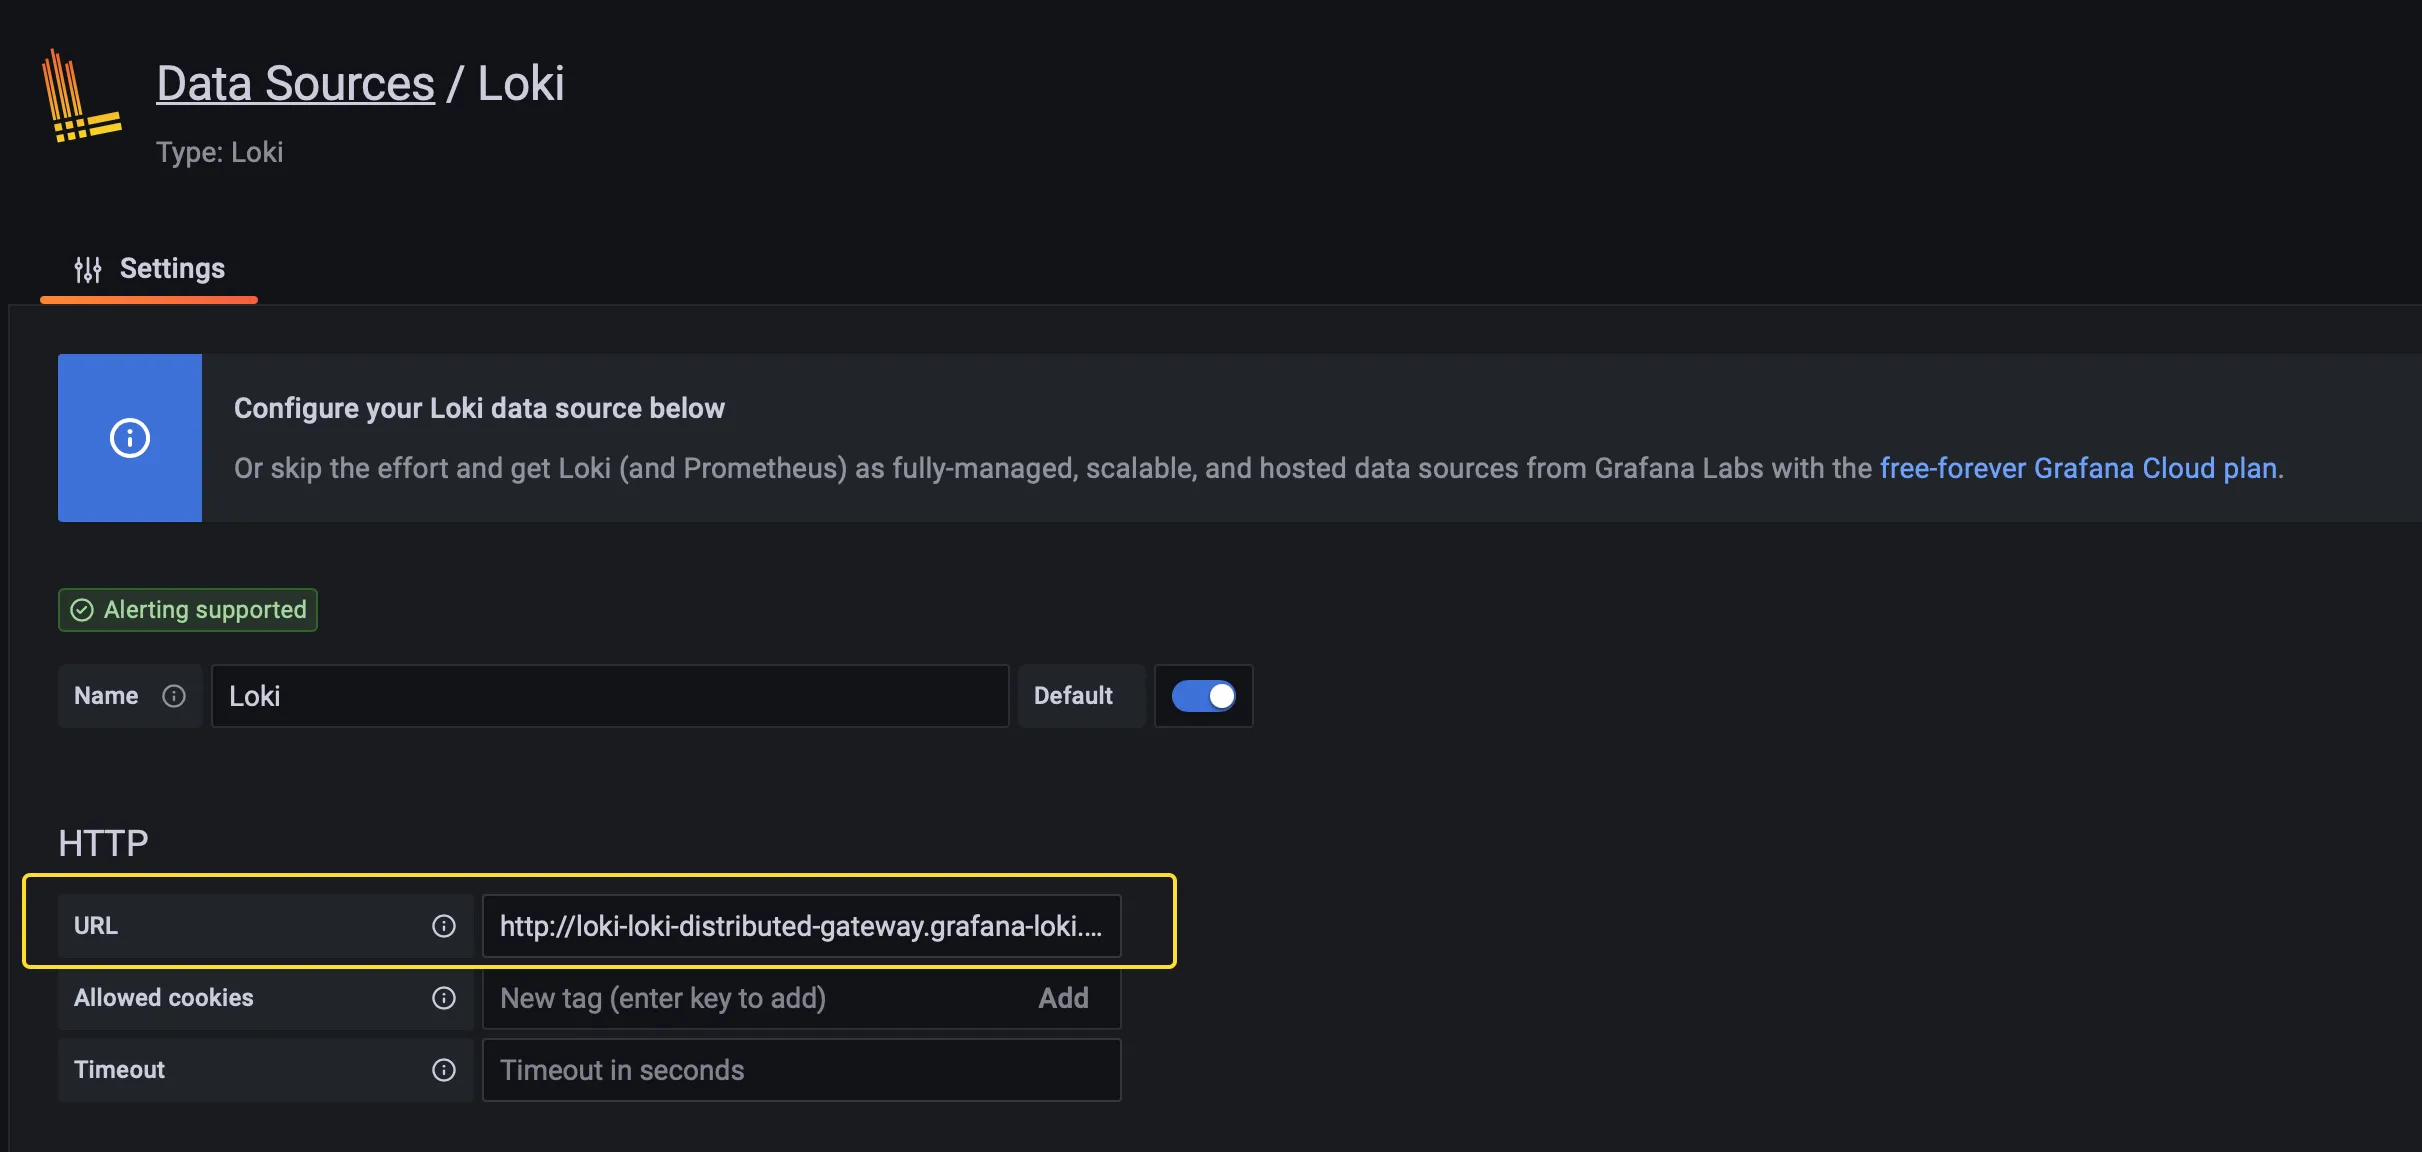
- Now logged into the Grafana Dashboard, add Grafana Loki as a data source:
Use the endpoint of the Grafana Loki gateway service as the URL [http://loki-loki-distributed-gateway.grafana-loki.svc.cluster.local](http://loki-loki-distributed-gateway.grafana-loki.svc.cluster.local/). Test, save, and exit!
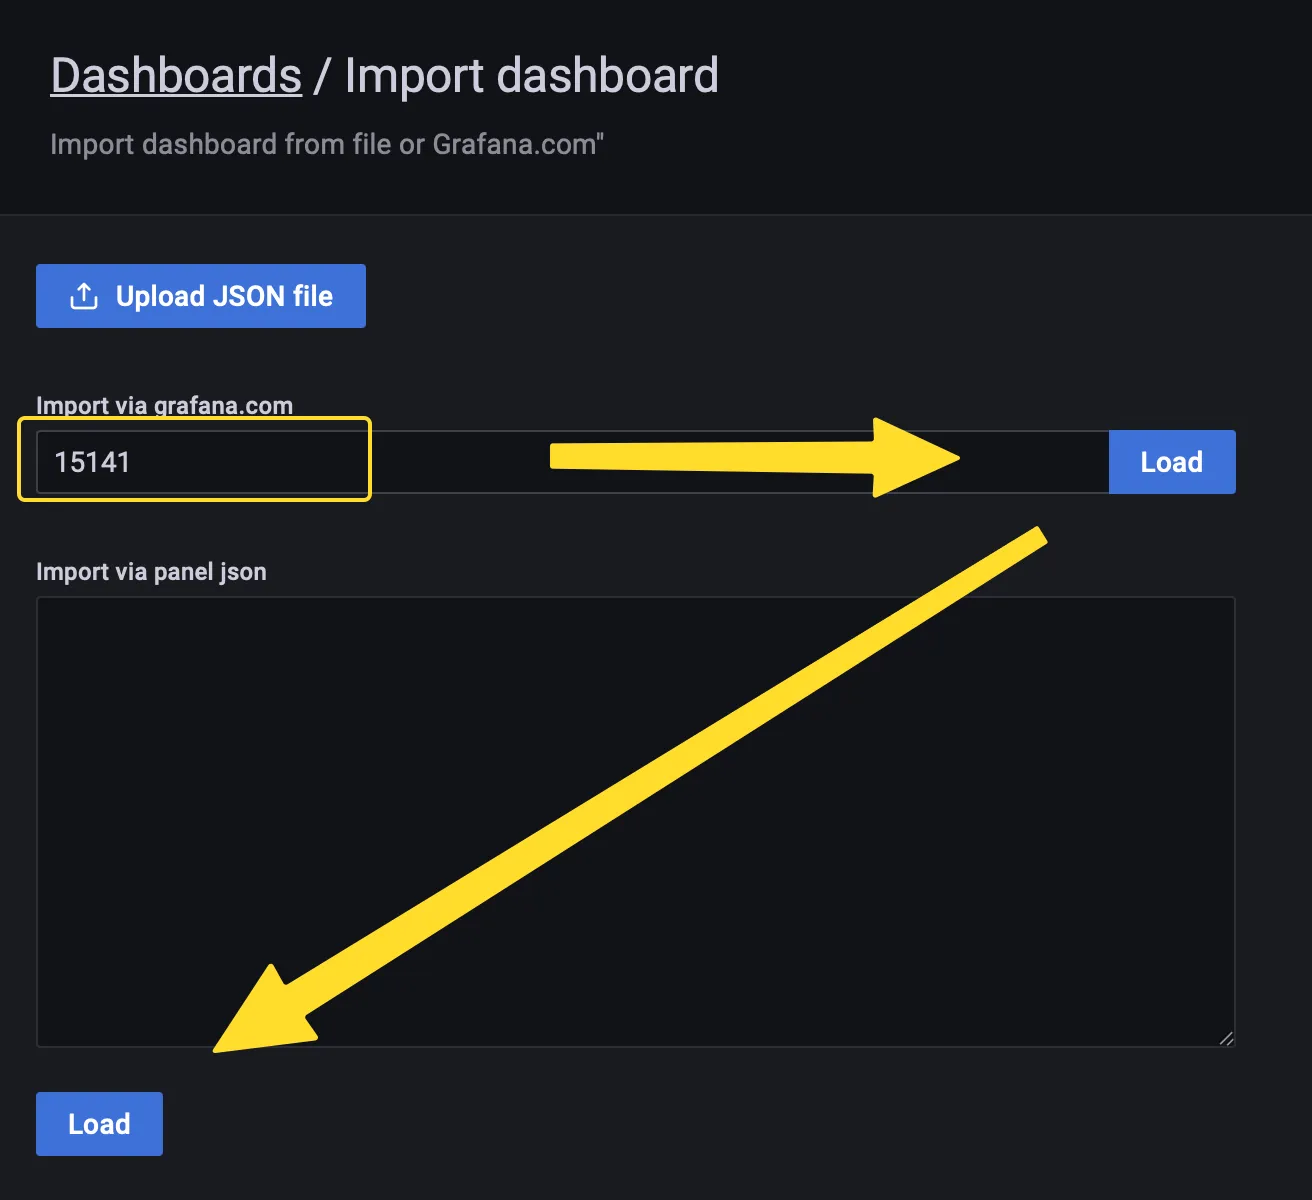
- Finally, add a dashboard to view your logs. Start with an existing dashboard and tailor it to your needs. A good starting point is this dashboard: : https://grafana.com/grafana/dashboards/15141-kubernetes-service-logs/
Copy the dashboard template ID and paste it into the text field of your Grafana Dashboard import page:
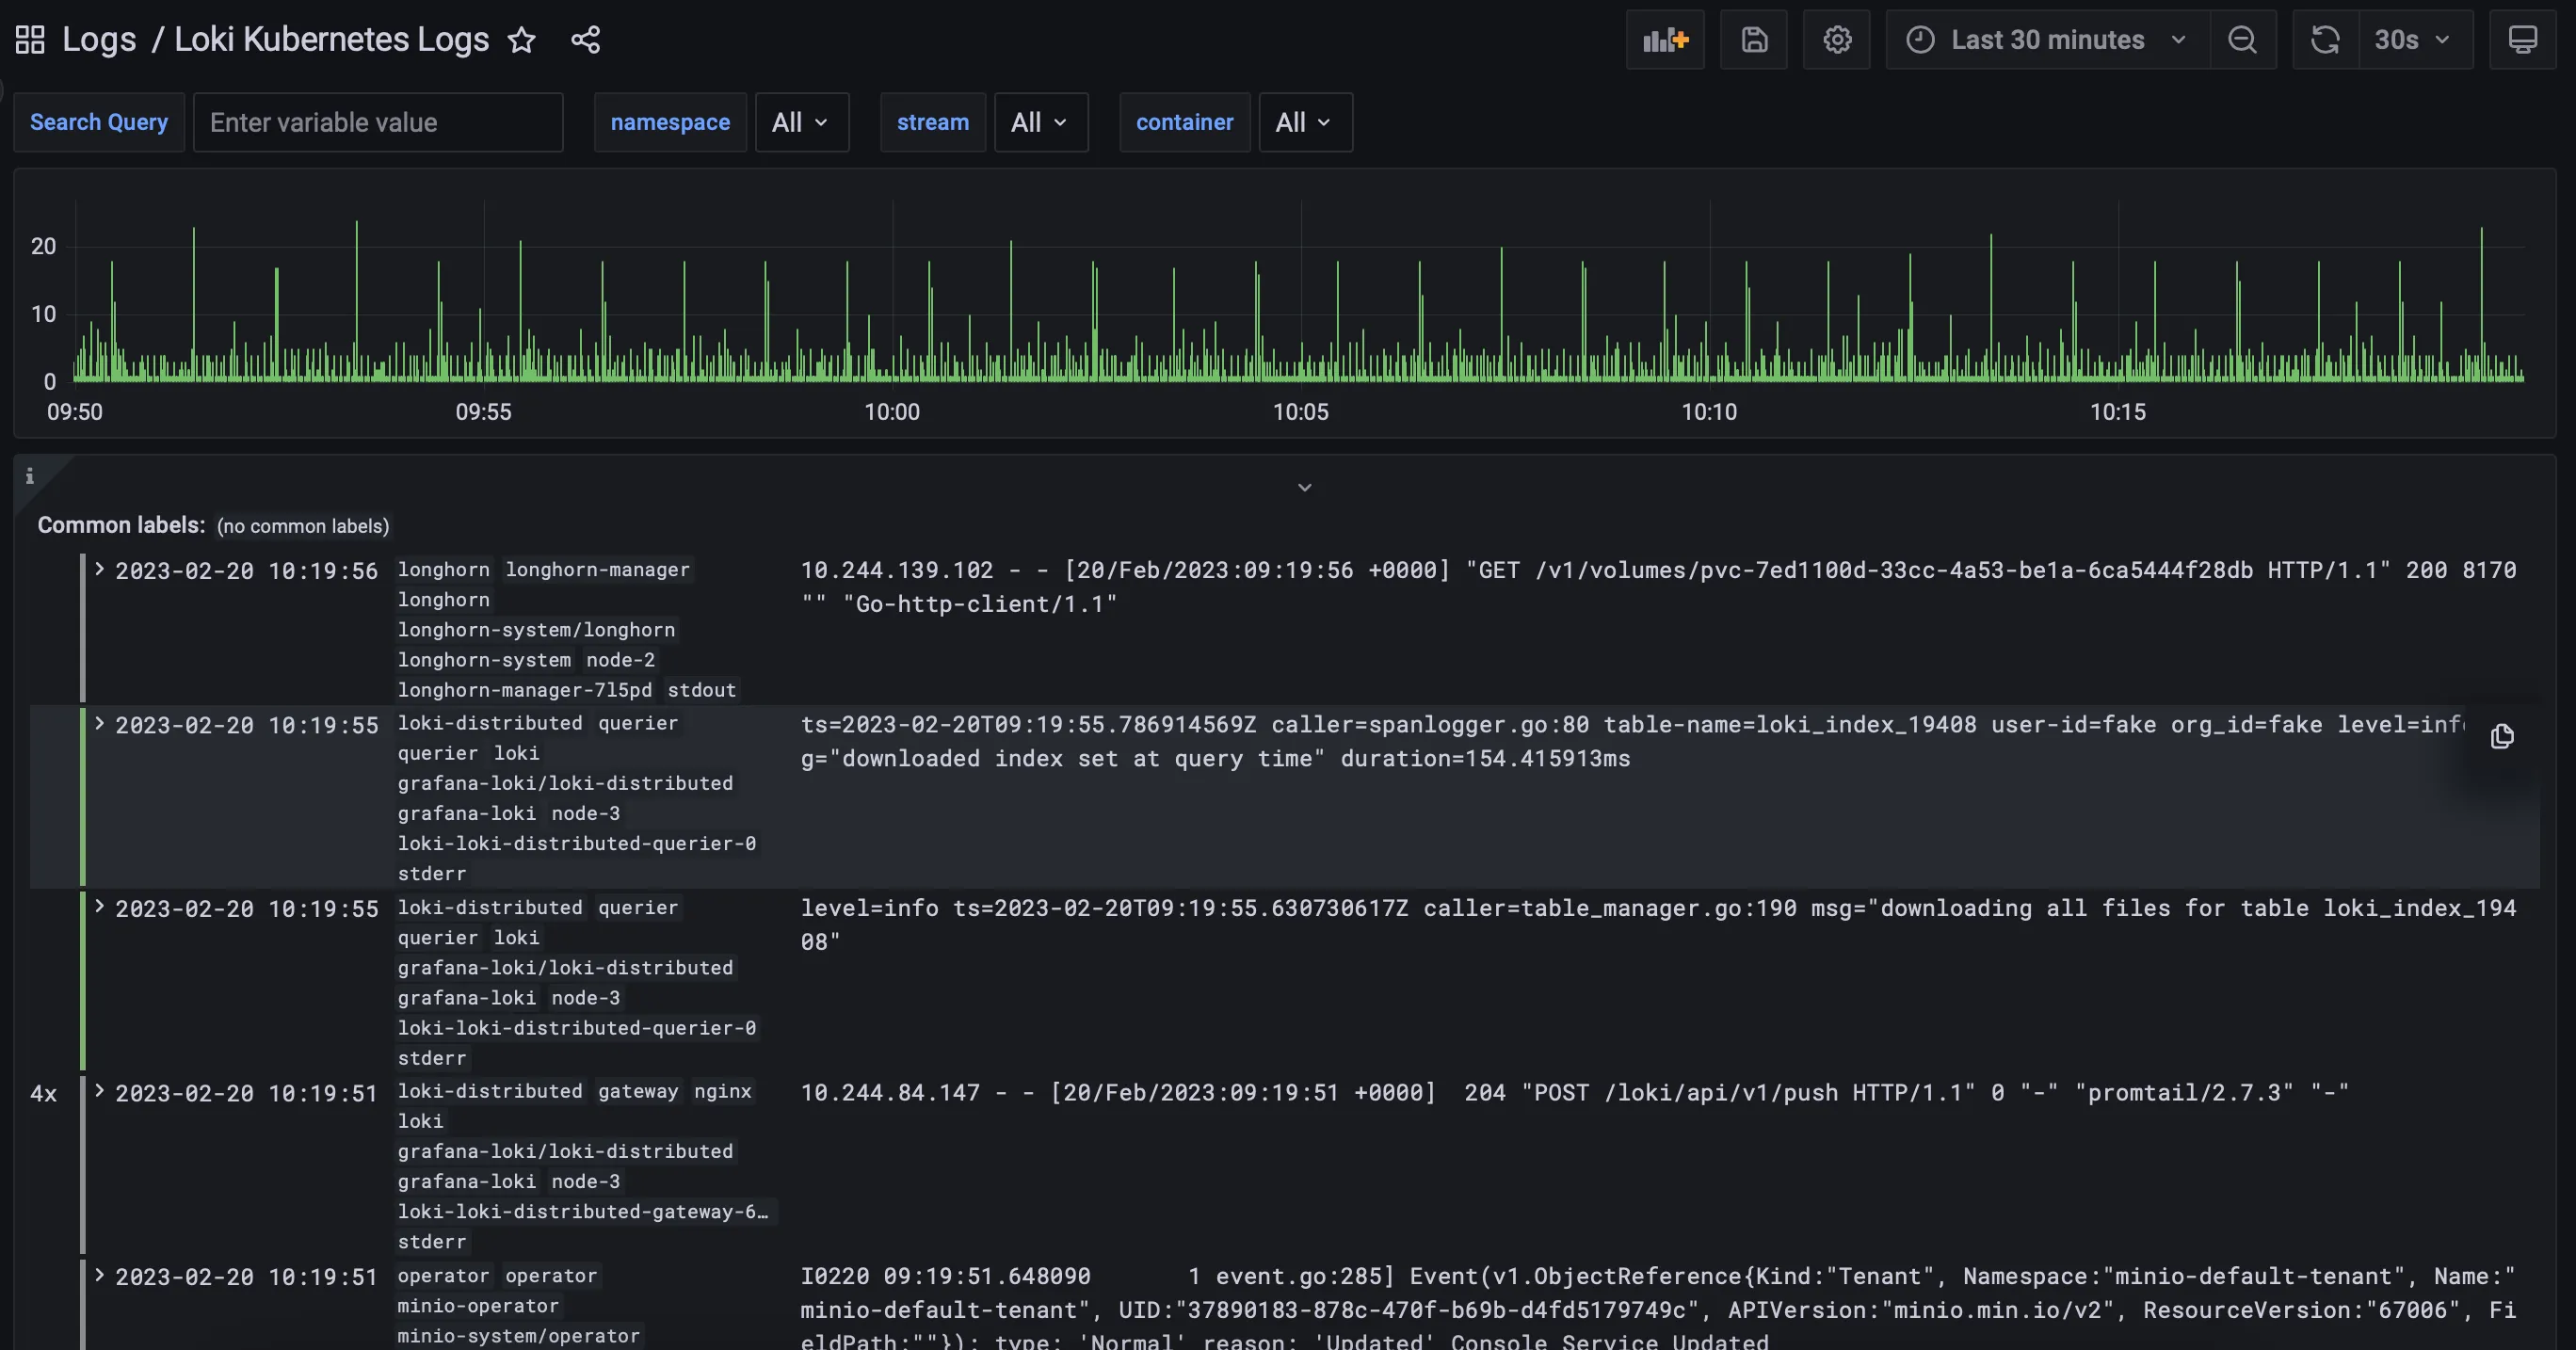
Now all the pieces should come together, and you should be able to see logs from your Kubernetes workloads directly in your Grafana interface, providing an almost real-time experience: