Auto Scaling Based on ELB Monitoring Metrics
By default, Kubernetes scales a workload based on resource usage metrics such as CPU and memory. However, this mechanism cannot reflect the real-time resource usage when traffic bursts arrive, because the collected CPU and memory usage data lags behind the actual load balancer traffic metrics. For some services (such as flash sale and social media) that require fast auto scaling, scaling based on this rule may not be performed in a timely manner and cannot meet these services' actual needs. In this case, auto scaling based on ELB QPS data can respond to service requirements more timely.
Solution Design
This guide covers the environment setup required for implementing auto scaling based on ELB monitoring metrics. This setup is a prerequisite for both KEDA and Prometheus Adapter scaling solutions.The core of this solution is to collect ELB metric data and expose it to Prometheus for monitoring and scaling decisions. This is achieved by implementing a Prometheus exporter that retrieves the ELB metrics, transforms them into Prometheus-compatible format, and then publishes them so they can be scraped and stored by Prometheus.
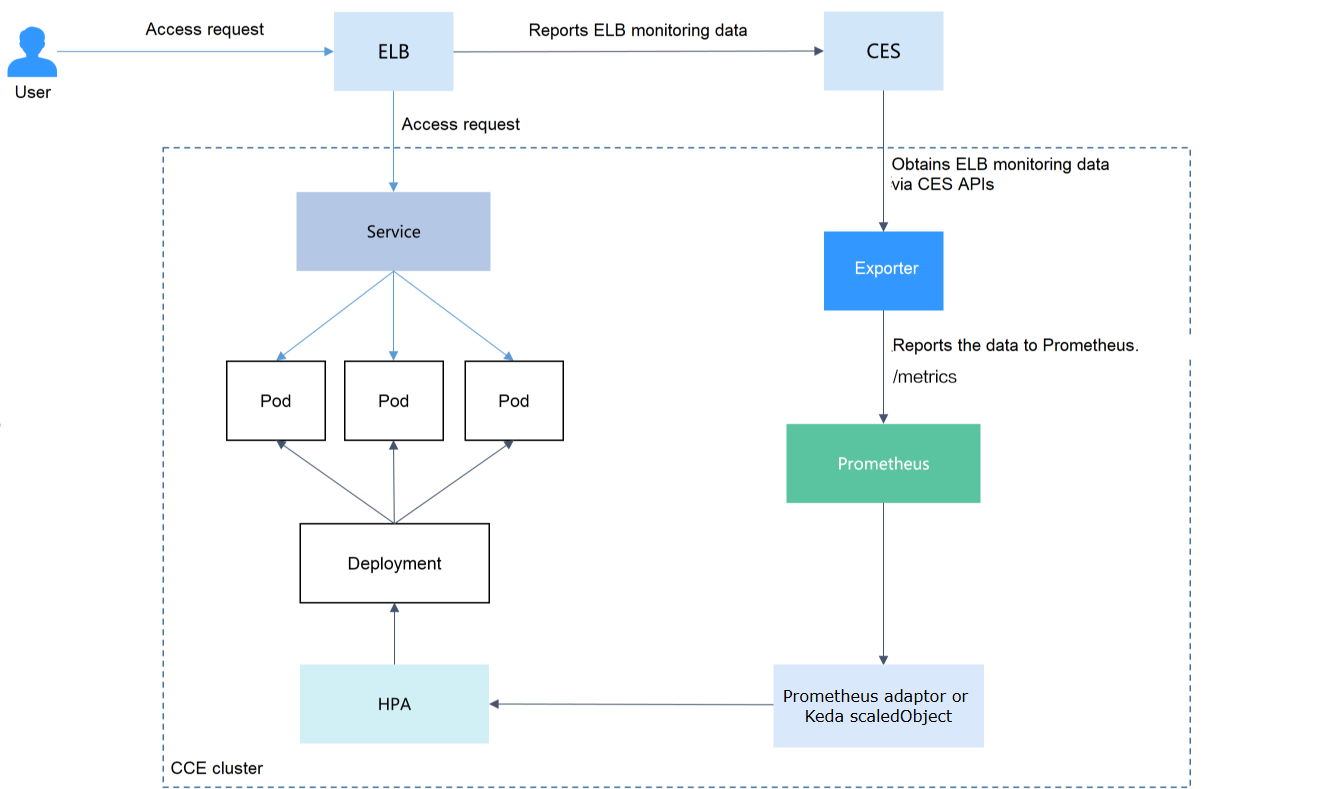
In this guide, we’ll use cloudeye-exporter, a custom Prometheus exporter designed to collect metrics from T Cloud Public’s Cloud Eye service. The exporter retrieves monitoring data, converts it into Prometheus-compatible format, and exposes it through an endpoint that Prometheus can scrape at regular intervals.
Additional metrics can be gathered in the same manner by extending the exporter’s configuration to include other service metrics. By adjusting the metric definitions and endpoints, the same workflow (data retrieval, conversion to Prometheus format, and periodic scraping) can be applied to monitor different resources such as ECS instances, EVS volumes, RDS databases, or networking components. This approach provides a consistent and scalable method for integrating a wide range of T Cloud Public metrics into Prometheus.
Prerequisites
- You should have a basic understanding of Prometheus and know how to develop a Prometheus exporter.
- Ensure that the Cloud Native Cluster Monitoring add-on is installed in your cluster, which must be running Kubernetes version 1.17 or later.
- Configure the Cloud Native Cluster Monitoring add-on to operate in
server mode.
Building the Exporter Image
Installing Buildpacks
In this tutorial, the container image is built using Buildpacks, a framework that automates the creation of production-ready container images without the need for a Dockerfile. Buildpacks detect the application’s language and dependencies, compile the necessary runtime environment, and package everything into an optimized image. This approach simplifies image creation, ensures consistent builds across environments, and aligns with best practices for secure and maintainable containerized applications.
git clone https://github.com/opentelekomcloud-blueprints/cloudeye-exporter
curl -sSL "https://github.com/buildpacks/pack/releases/download/v0.32.1/pack-v0.32.1-linux.tgz" | sudo tar -C /usr/local/bin/ --no-same-owner -xzv pack
This method produces an OCI-compliant image, ensuring compatibility with nearly all container runtimes that support the Open Container Initiative standard. Alternatively, the same image can be built using a traditional Dockerfile and the docker build command if preferred.
Building the image
The image name is cloudeye-exporter and the image version is 1.0.
cd cloudeye-exporter
pack build cloudeye-exporter:v1 --builder gcr.io/buildpacks/builder:v1
Pushing the image to SWR
-
(Optional) Log in to the SWR console, choose Organizations in the navigation pane, and click Create Organization in the upper right corner of the page.
-
In the navigation pane, choose My Images and then click Upload Through Client. On the page displayed, click Generate a temporary login command and click
 to
copy the command.
to
copy the command. -
Run the login command copied in the previous step on the cluster node. If the login is successful, the message "Login Succeeded" is displayed.
-
Tag the
cloudeye-exporterimage.
docker tag {IMG1:TAG1}/{IMG_RERO_ADDR}/{ORG_NAME}/{IMG2:TAG2}
{IMG1:TAG1}: name and tag of the local image to be uploaded.{IMG_RERO_ADDR}: The domain name at the end of the login command in is the image repository address, which can be obtained on the SWR console.{ORG_NAME}: name of the organization created in.{IMG2:TAG2}: desired image name and tag to be displayed on the SWR console.
docker tag cloudeye-exporter:1.0 swr.eu-de.otc.t-systems.com/cloud-develop/cloudeye-exporter:1.0
- Pushing the image to the image repository.
docker push {IMG_RERO_ADDR}/{ORG_NAME}/{IMG2:TAG2}
docker push swr.eu-de.otc.t-systems.com/cloud-develop/cloudeye-exporter:1.0
The following information will be returned upon a successful push:
The push refers to repository [swr.eu-de.otc.t-systems.com/cloud-develop/cloudeye-exporter]
030***: Pushed
v1.0: digest: sha256:eb7e3bbd*** size: **
To view the pushed image, go to the SWR console and refresh the My Images page.
Installing Prometheus/Grafana Stack & cloudeye-exporter artifacts
Deploy the Prometheus and Grafana stack using the kube-prometheus-stack Helm chart. The configuration values will be automatically generated at deploy/manifests/prometheus-stack/override.yaml. You can compare this file with the default default.yaml to review the applied customizations.
Execute ./install-stack.sh to begin the deployment. This script not only installs the kube-prometheus-stack but also sets up all required artifacts for the cloudeye-exporter integration.
Run ./install-stack.sh. This script will deploy, besides the
kube-prometheus-stack, all the cloudeye-exporter related artifacts.
Deploying the Exporter
Prometheus can dynamically monitor pods if you add Prometheus
annotations to the pods (the default path is /metrics). Common annotations in Prometheus are as follows:
prometheus.io/scrape: If the value istrue, the pod will bemonitored.prometheus.io/path: URL from which the data is collected. The default value is/metrics.prometheus.io/port: port number of the endpoint to collect data from.prometheus.io/scheme: Defaults tohttp. If HTTPS is configured for security purposes, change the value tohttps.
-
Use kubectl to connect to the cluster.
-
Create a secret, which will be used by cloudeye-exporter for authentication.
a. Create a copy of clouds.tpl template, name it clouds.yml file with the following content:
auth_url: indicates the IAM endpoint, which can be obtained from Regions and Endpoints.project_name: indicates the project name. On the My Credential page, view the project name and project ID in the Projects area.access_keyandsecret_key: You can obtain them from Access Keys.region: indicates the region name, which must correspond to the project inproject_name.
b. Then encode it to base64 with the following command:
base64 -i clouds.yamlc. Create the cloudeye-exporter-clouds-secret.yaml file with the following content:
cloudeye-exporter-clouds-secret.yamlapiVersion: v1kind: Secretmetadata:name: cloudeye-exporter-cloudsnamespace: defaulttype: Opaquedata:clouds.yaml: Z2xvYmFsOg************************************************************d. Create secret and deploy the exporter.
kubectl apply -f cloudeye-exporter-clouds-secret.yamlkubectl apply -f cloudeye-exporter-clouds-secret.yamlkubectl apply -f cloudeye-exporter-clouds-secret.yaml
Getting ELB and ELB Listener IDs
In this example, the ELB metrics associated with the workload need to be
monitored. Therefore, the target workload must use the Service or
Ingress of the LoadBalancer type.
-
View the access mode of the workload to be monitored and obtain the ELB ID and ELB listener ID.
a. On the CCE cluster console, choose Networking. On the Services or Ingresses tab page, view the Service or Ingress of the
LoadBalancertype and click the load balancer to access the load balancer page and copy the ELB ID.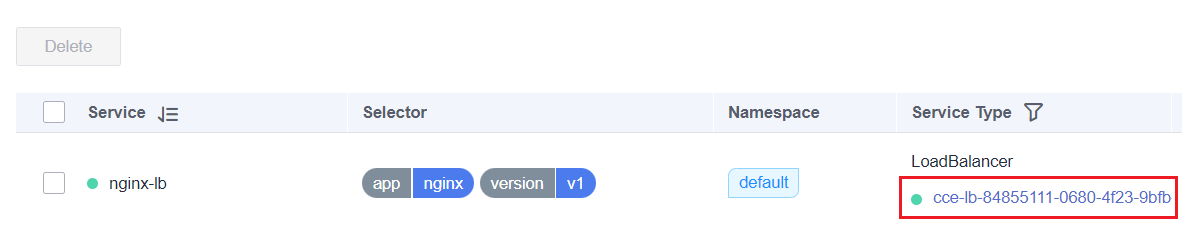
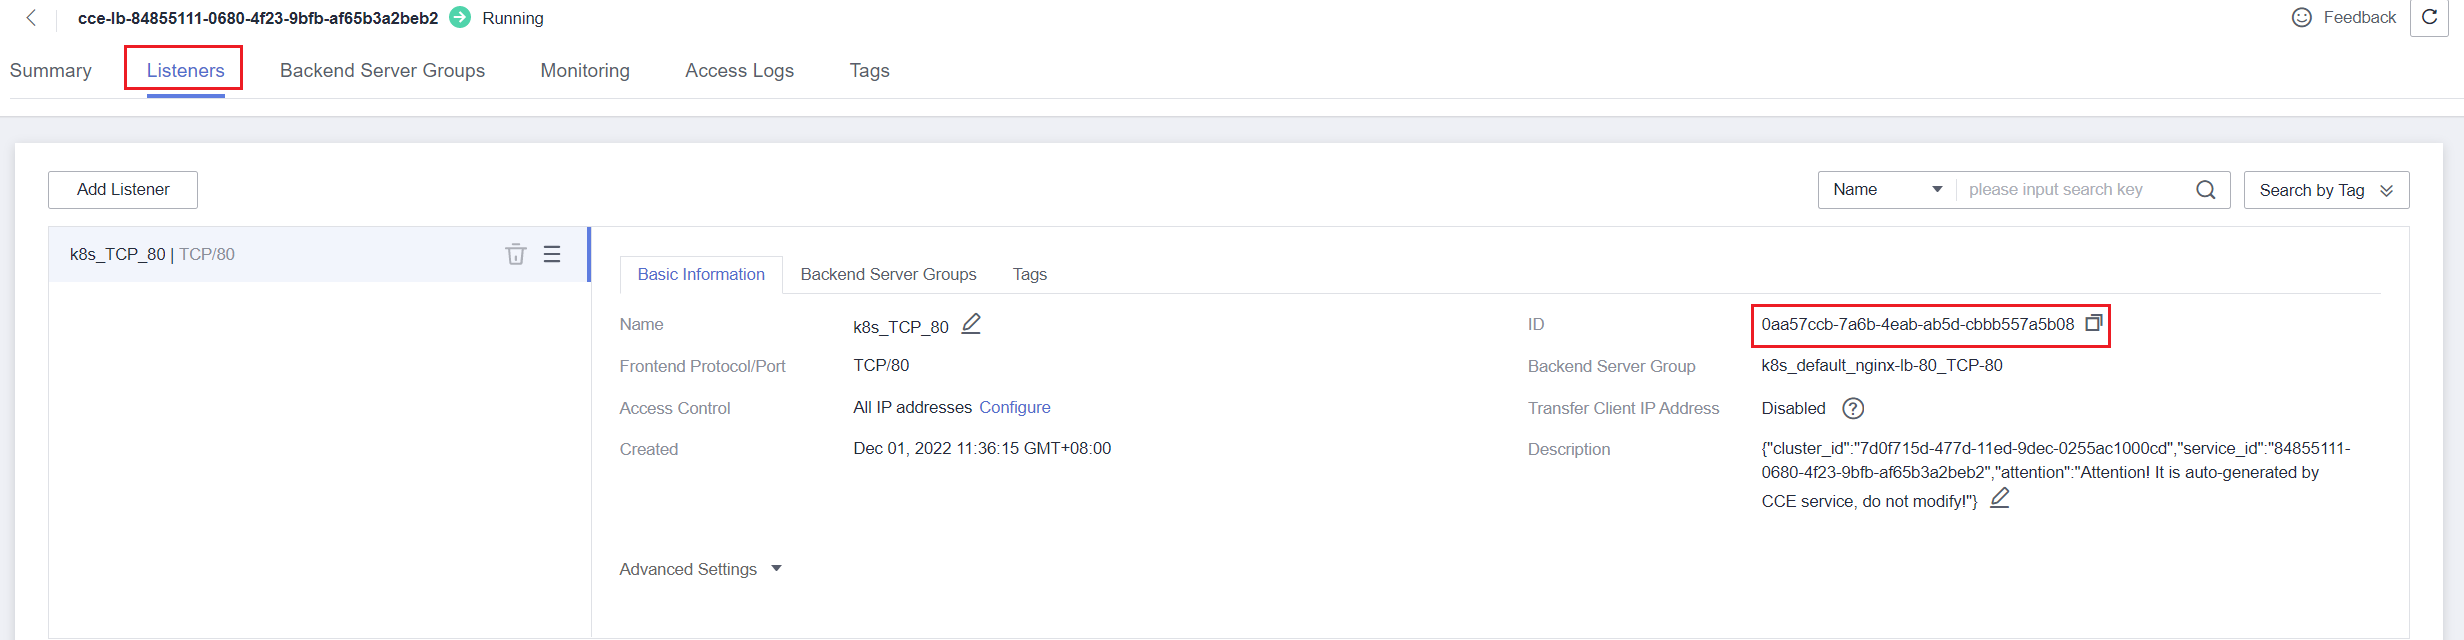
b. On the Listeners tab, view the listener corresponding to the workload and copy the listener ID which corresponds to port
80.
-
Export the Elastic Load Balancer's ID and listener ID as an env variables
export ELB_ID="66872*****"export ELB_LISTENER_ID="94424*****"
Installing Nginx Ingress Controller
Next, we are going to install the Nginx Ingress Controller using the script ./install-ingress.sh:
envsubst < nginx-ingress-controller/override.tpl  nginx-ingress-controller/override.yaml
sleep 15

helm upgrade --install -f nginx-ingress-controller/override.yaml --install ingress-nginx ingress-nginx \
--repo https://kubernetes.github.io/ingress-nginx --namespace ingress-nginx --create-namespace
Installing an Nginx Demo Workload
We are going to need a workload to test HPA and the autoscaling via our custom CloudEye derived metrics. For that matter we will deploy a dummy nginx deployment and service using the script ./install-workload.sh:
kubectl create namespace applications
kubectl apply -f deploy/manifests/nginx-deployment.yaml
kubectl apply -f deploy/manifests/nginx-ingress.yaml
Appendix
ELB Listener Metrics
The following table lists the Elastic Load Balancer Listener metrics that can be collected using the method described in sections above.
| Metric | Name | Unit | Description |
|---|---|---|---|
m1_cps | Concurrent Connections | Count | Number of concurrent connections processed by a load balance |
m1e_server_rps | Reset Packets from Backend Servers | Count/Second | Number of reset packets sent from the backend server to clients. These reset packages are generated by the backend server and then forwarded by load balancers. |
m1f_lvs_rps | Reset Packets from Load Balancers | Count/Second | Number of reset packets sent from load balancers. |
m21_client_rps | Reset Packets from Clients | Count/Second | Number of reset packets sent from clients to the backend server. These reset packages are generated by the clients and then forwarded by load balancers. |
m22_in_bandwidth | Inbound Bandwidth | bit/s | Inbound bandwidth of a load balancer. |
m23_out_bandwidth | Outbound Bandwidth | bit/s | Outbound bandwidth of a load balancer. |
m2_act_conn | Active Connections | Count | Number of current active connections. |
m3_inact_conn | Inactive Connections | Count | Number of current inactive connections. |
m4_ncps | New Connections | Count | Number of current new connections. |
m5_in_pps | Incoming Packets | Count | Number of packets sent to a load balancer. |
m6_out_pps | Outgoing Packets | Count | Number of packets sent from a load balancer. |
m7_in_Bps | Inbound Rate | byte/s | Number of incoming bytes per second on a load balancer. |
m8_out_Bps | Outbound Rate | byte/s | Number of outgoing bytes per second on a load balancer. |
Developing an Exporter
Prometheus periodically calls the /metrics API of the exporter to obtain metric data. Applications only need to report monitoring data
through /metrics. You can select a Prometheus client in a desired language and integrate it into applications to implement the
/metrics API. For details about the client, see Prometheus Client Libraries. For
details about how to write the exporter, see Writing Exporters.
The monitoring data must be in the format that Prometheus supports. Each data record provides the ELB ID, listener ID, namespace where the Service is located, Service name, and Service UID as labels, as shown in the following figure.
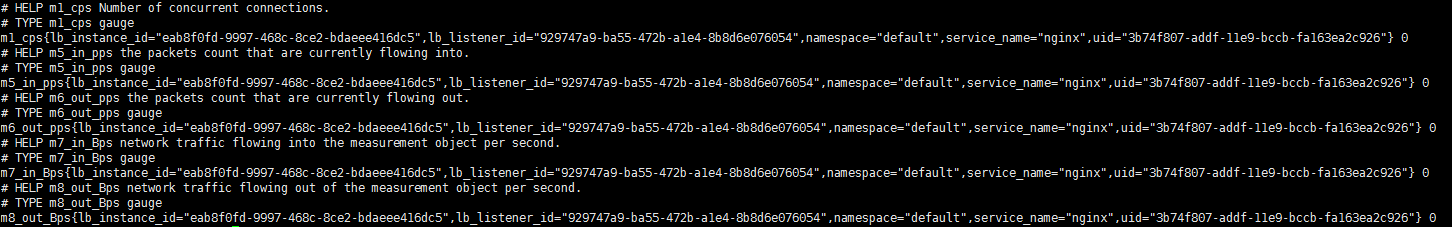
To obtain the preceding data, perform the following steps:
-
Obtain all Services.
The
annotationsfield in the returned information contains the ELB associated with the Service.kubernetes.io/elb.idkubernetes.io/elb.class
-
Use APIs in Querying Listeners to get the listener ID based on the load balancer ID obtained in the previous step.
-
Obtain the ELB monitoring data.
The ELB monitoring data is obtained using the CES APIs described in Querying Monitoring Data in Batches. For details about ELB monitoring metrics, see Monitoring Metrics. Example:
m1_cps: number of concurrent connectionsm5_in_pps: number of incoming data packetsm6_out_pps: number of outgoing data packetsm7_in_Bps: incoming ratem8_out_Bps: outgoing rate
-
Aggregate data in the format that Prometheus supports and expose the data through the
/metricsAPI.