Auto Scaling Based on ELB Monitoring Metrics with Prometheus Adapter
This article explains how to implement auto scaling with the Prometheus Adapter using ELB monitoring metrics, allowing the Horizontal Pod Autoscaler (HPA) to use custom metrics sourced from Prometheus.
Prerequisites
Before proceeding with this guide, make sure you have completed the environment setup outlined in this section. You should additionally have a basic understanding of the Kubernetes Horizontal Pod Autoscaler (HPA) and be familiar with Prometheus metrics and query syntax.
Solution Design
This section outlines an auto scaling approach that leverages ELB monitoring metrics. The core idea is to take ELB metric data exposed to Prometheus, convert it into a format compatible with the Kubernetes Metrics API, and make it available for the Horizontal Pod Autoscaler (HPA) to consume. This allows scaling decisions to be driven directly by ELB traffic patterns rather than traditional CPU or memory usage.
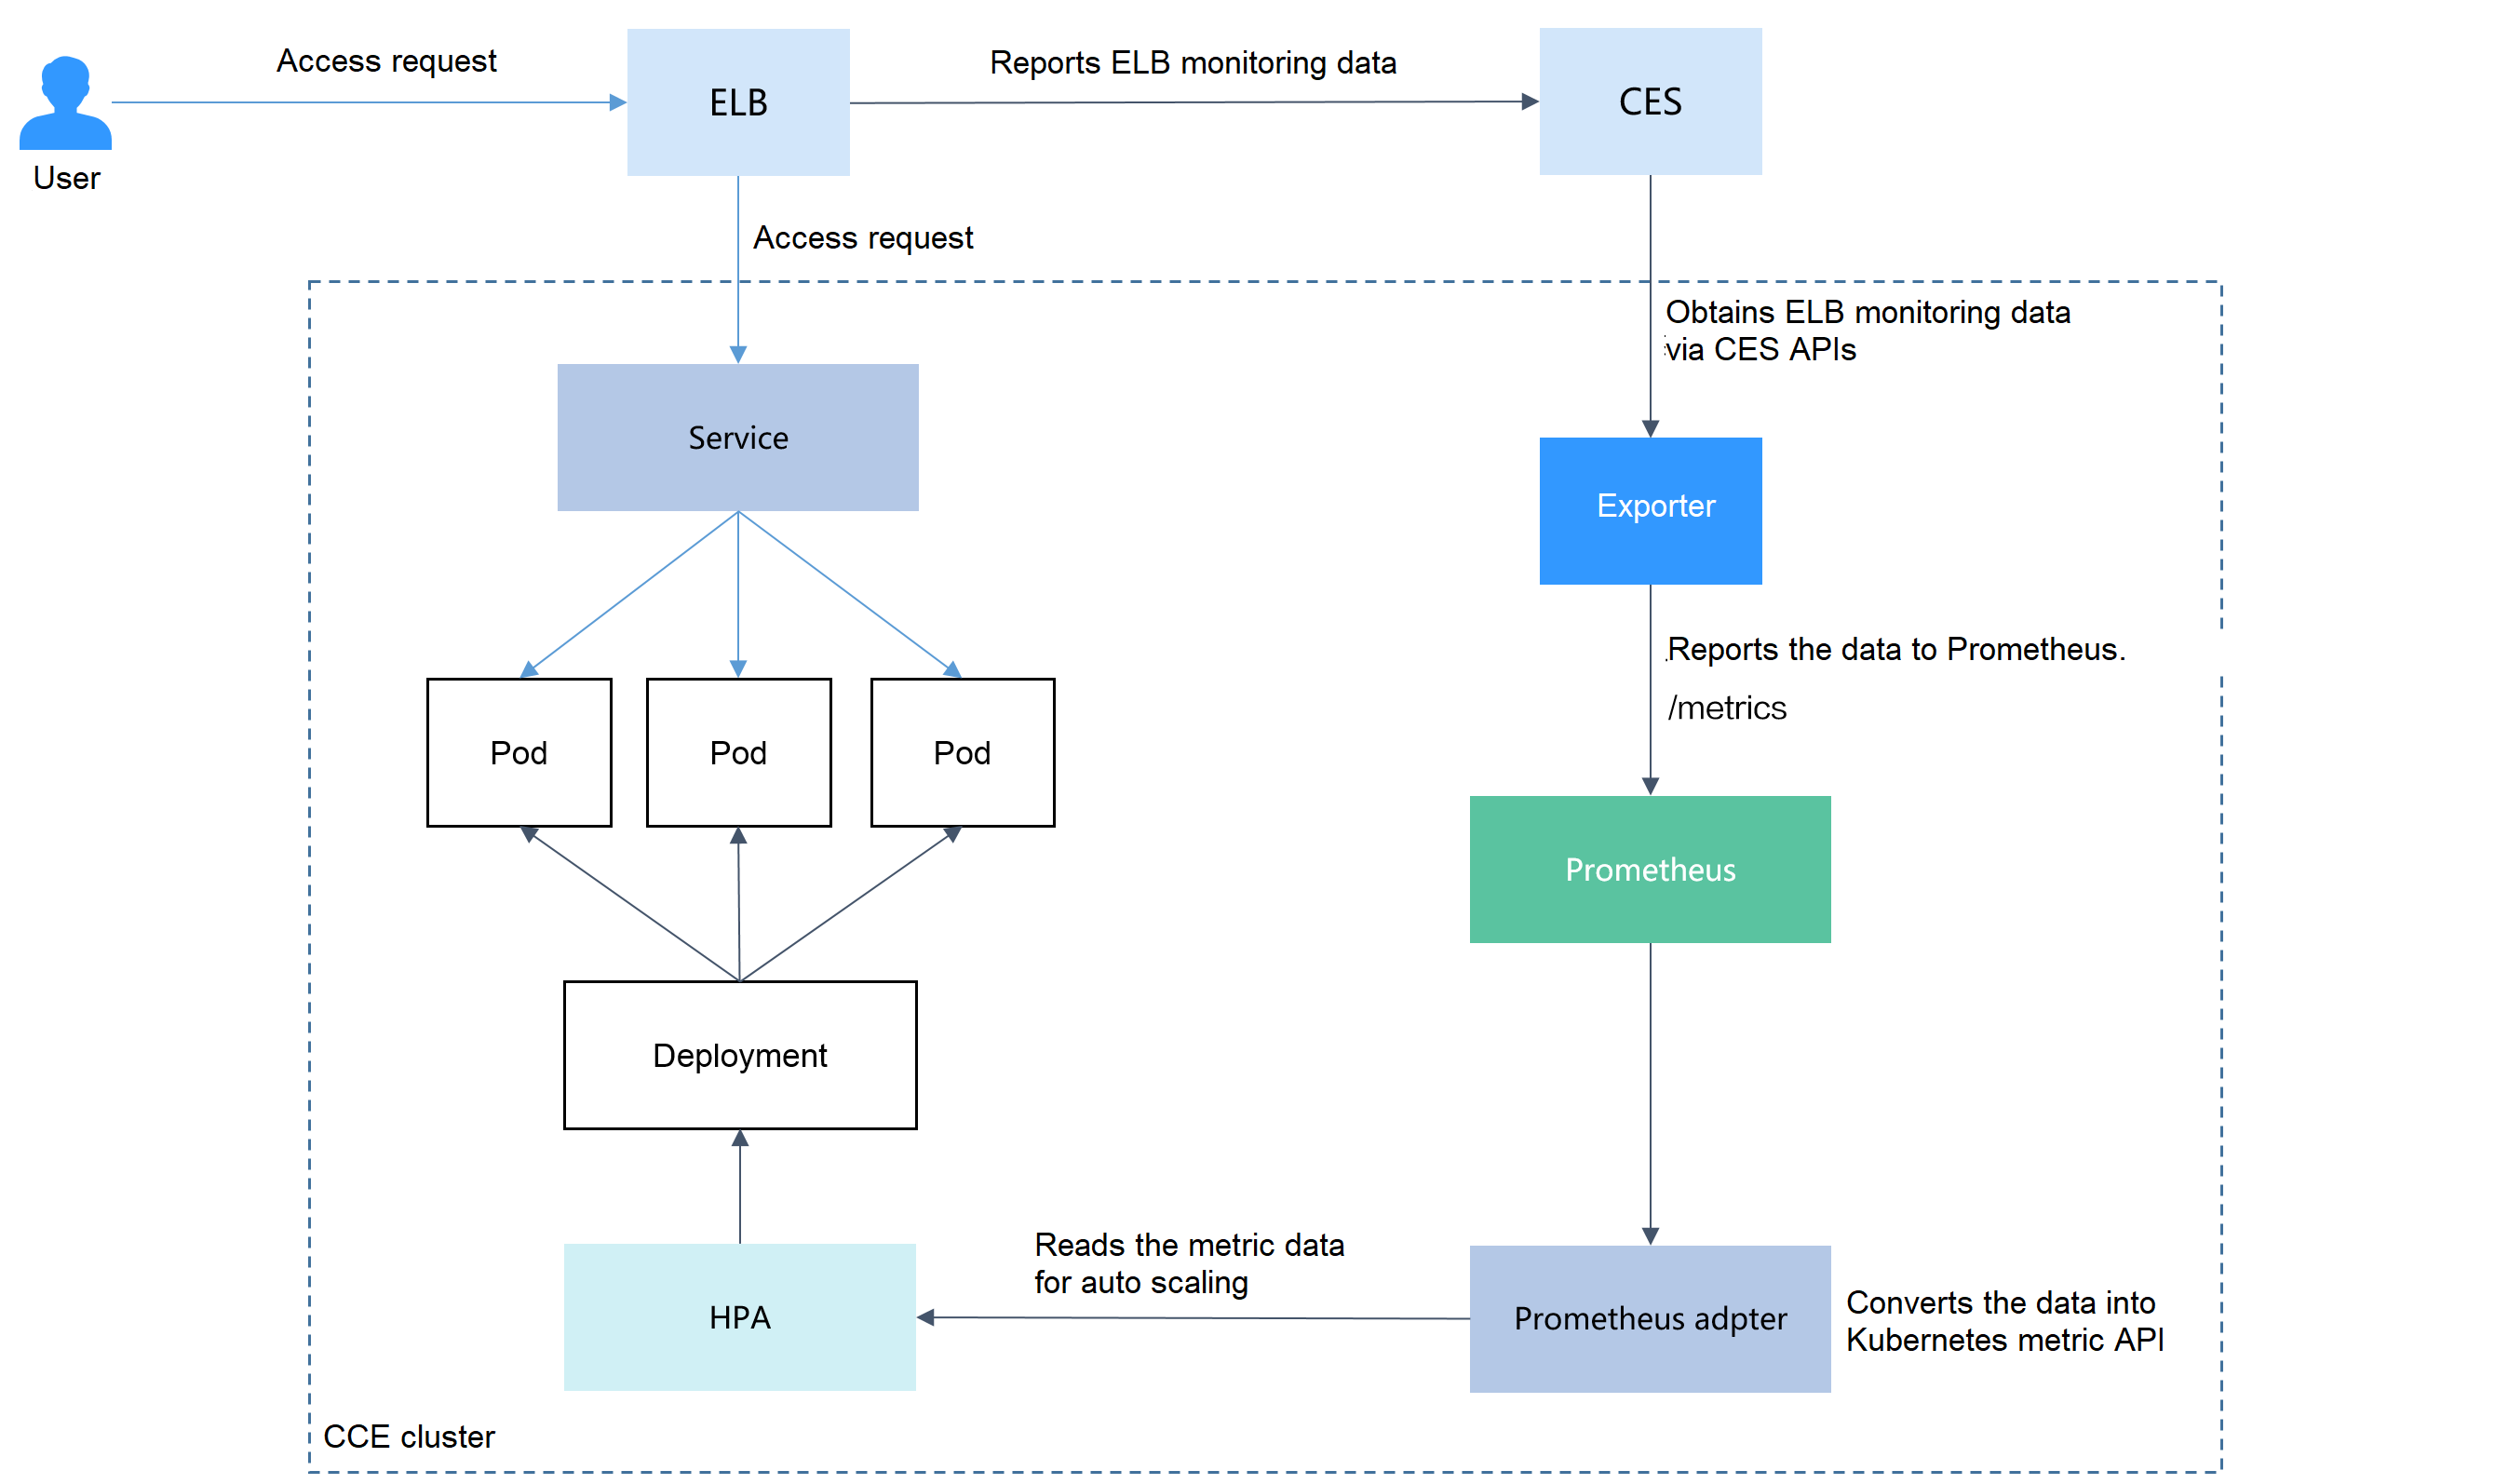
The implementation involves two main steps: exposing the Prometheus metrics through the Kubernetes Metrics API using the Prometheus Adapter, and defining an HPA policy that references the ELB-based metrics for scaling.
Installing a Prometheus Adapter
The key step is deploying the Prometheus Adapter, which provides an additional Custom Metrics API endpoint. This component connects the Cloud Eye metrics exposed in Prometheus with the Kubernetes HPA. To deploy it, run the script ./install-adapter.sh.
envsubst < prometheus-adapter/override.tpl  prometheus-adapter/override.yaml
sleep 15

helm repo add prometheus-community https://prometheus-community.github.io/helm-charts
helm repo update

helm upgrade --install prometheus-adapter prometheus-community/prometheus-adapter \
--values prometheus-adapter/override.yaml \
-n monitoring --create-namespace
The configuration values for the Prometheus Adapter Helm chart are automatically generated at deploy/manifests/prometheus-adapter/override.yaml. You can compare this file with the default default.yaml to review the applied modifications.
Creating an HPA Policy
Once the Prometheus Adapter converts the exporter’s data into the Kubernetes Metrics API format, you can define an HPA policy to enable automatic scaling based on those metrics.
-
Create an HPA policy. The inbound traffic of the ELB load balancer is used to trigger scale-out. When the value of
m7_in_Bps(inbound traffic rate) exceeds1000, the nginx Deployment will be scaled.apiVersion: autoscaling/v2
kind: HorizontalPodAutoscaler
metadata:
name: nginx
namespace: default
spec:
scaleTargetRef:
apiVersion: apps/v1
kind: Deployment
name: nginx
minReplicas: 1
maxReplicas: 10
metrics:
- type: Object
object:
metric:
name: elb01_listener_m7_in_Bps
describedObject:
apiVersion: v1
kind: Service
name: cloudeye-exporter
target:
type: Value
value: 1000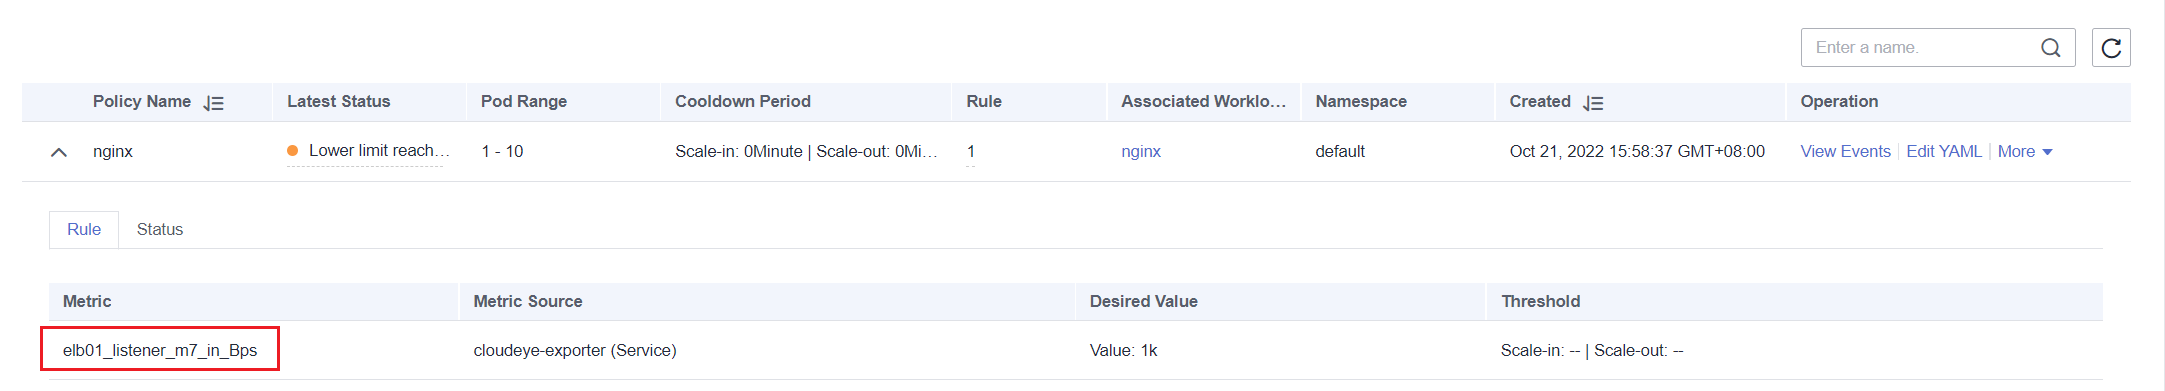
-
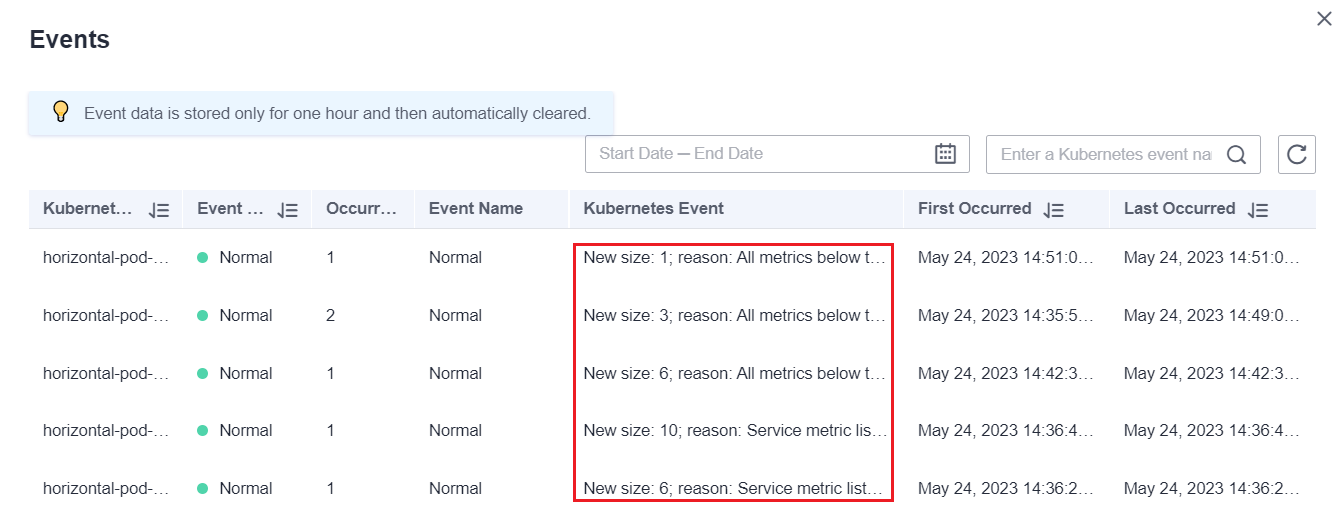
After creating the HPA policy, run a load test on the workload by generating traffic through the ELB. The HPA controller will monitor the defined metrics and decide whether to scale the deployment based on the configured thresholds. In the Events view, check the Kubernetes Event column to review the recorded scaling activities: